Power BI Tutorial for Beginners
Summary
TLDRThis tutorial offers a concise introduction to Power BI, guiding viewers through the process of importing data, building data models, creating visualizations, and sharing reports and dashboards. Starting with the installation from the Microsoft Store, it covers selecting the right version, navigating the interface, and using Power Query Editor for data refinement. The video demonstrates creating a report with visuals like line charts and tables, and concludes with sharing options on the Power BI web service, encouraging further exploration of this powerful analytics tool.
Takeaways
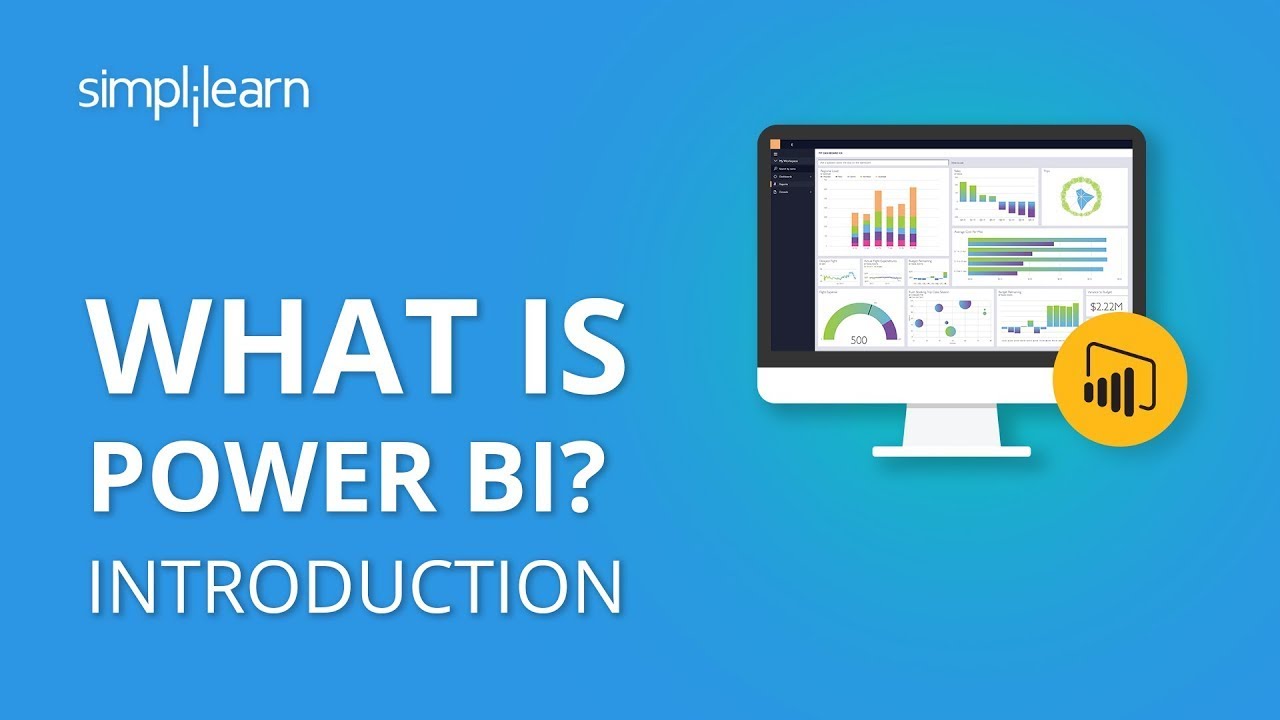
- 📈 Power BI is a tool designed to help organizations analyze data and make informed decisions based on it.
- 💾 Power BI can be obtained from the Microsoft Store with different versions: Power BI for viewing reports, Power BI Desktop for full data modeling and report building, and Report Builder for a less feature-rich experience.
- 🚀 To get started with Power BI, users can install Power BI Desktop from the Microsoft Store and explore its functionalities.
- 🔍 Power BI allows for importing data from various sources, including Excel workbooks, which can be easily integrated into the platform.
- 🔄 Power BI's 'Get Data' feature offers a wide range of data sources, making it versatile for different types of data.
- 🗂️ After importing data, users can preview and select specific tables or sheets to load into Power BI, with options to load as-is or transform the data.
- 🛠️ Power Query Editor within Power BI allows for data transformation and cleaning before it is fully integrated into the platform.
- 🔗 Power BI automatically detects relationships between tables, such as a common 'Customer ID', simplifying the data modeling process.
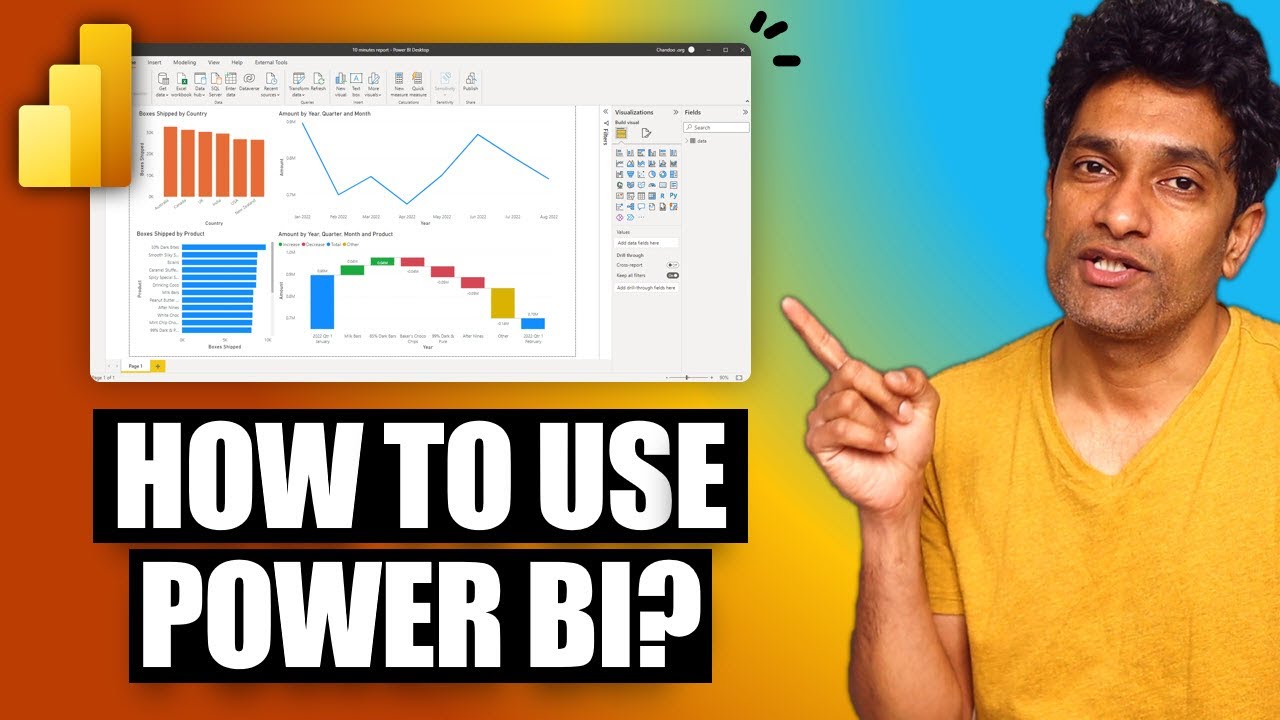
- 📊 Visualizations in Power BI can be customized and include various types like line charts, bar charts, and tables to represent data effectively.
- 📝 Users can interact with visuals, such as clicking on a customer name to filter related data across connected visuals, enhancing data exploration.
- 🔑 Power BI supports sharing reports and dashboards through various methods, including publishing to the Power BI web service, embedding in SharePoint, or sharing via email and Microsoft Teams.
Q & A
What is the main purpose of Power BI as described in the script?
-The main purpose of Power BI, as described in the script, is to help organizations understand the stories behind their data and make informed decisions based on that data.
How can one obtain Power BI according to the video?
-To obtain Power BI, one should open the Microsoft Store, search for Power BI in the search field, and choose from the available options: Power BI for viewing reports, Power BI Desktop for full functionality, or Report Builder for a less feature-rich experience.
What are the three different Power BI options available in the Microsoft Store?
-The three options are Power BI for viewing and interacting with reports, Power BI Desktop for modeling data and building reports, and the Report Builder which has similar functionalities but is not as feature-rich as Desktop.
What is the initial step to import data into Power BI?
-The initial step to import data into Power BI is to click on 'Get Data' from the 'Home' tab on the ribbon or from the 'Add data' option on the left-hand side.
How can the data be previewed before importing into Power BI?
-The data can be previewed by clicking on the table name in the Navigator window after selecting the data source, which allows you to see a sample of the data before loading it into Power BI.
What is the purpose of the Power Query Editor in Power BI?
-The Power Query Editor is used to modify and clean the data before bringing it into Power BI. It serves as a middle layer between the original data source and Power BI, allowing users to transform data without affecting the original source.
How can inconsistencies in data, like different references to the same country, be resolved in Power BI?
-Inconsistencies can be resolved using the Replace Values feature in the Power Query Editor, where you can find and replace different references, such as 'US' with 'United States'.
Outlines
📊 Introduction to Power BI
Kevin introduces the video with an overview of Power BI's capabilities in data analysis and storytelling. He explains the importance of understanding the stories behind data and making informed decisions. The video will guide viewers through the process of importing data into Power BI, building a data model, adding visuals, filtering data, and sharing reports and dashboards. Kevin also demonstrates how to download and install Power BI Desktop from the Microsoft Store, navigate the initial interface, and access learning resources. He emphasizes the ease of importing data from various sources, using an Excel workbook as an example.
🔍 Data Import and Transformation
This section focuses on the process of importing and transforming data within Power BI. Kevin shows how to access the 'Get Data' feature and select data sources, such as an Excel workbook. He previews the data, discusses the option to load data as-is or transform it before import, and highlights the benefits of using Power Query Editor for data cleaning and modification. The summary includes steps for replacing inconsistent values, removing unnecessary columns, and applying transformations that will automatically update with new data. The paragraph concludes with the establishment of data relationships and the transition to the Model view.
📈 Building Visuals and Reports
Kevin proceeds to build a report by selecting and customizing various visualizations to represent data effectively. He creates a line chart to display cookies shipped over time, adjusting the granularity from daily to monthly or yearly views. He also formats the visual with a title and color scheme that aligns with the Kevin Cookie Company's branding. The summary details the process of adding a card visual to show total revenue, inserting a table for customer names, and demonstrating the interactive filtering capabilities between visuals. Kevin discusses the ease of adding more pages for different data views and the steps for saving and publishing the report.
🔄 Sharing and Publishing the Report
The final paragraph outlines the steps for sharing and publishing the completed report. Kevin explains how to save changes, select a workspace for publishing, and access the report on the Power BI web service. He explores various sharing options, including embedding the report on SharePoint or a website, generating a QR code, exporting to PowerPoint or PDF, and sharing via email or Microsoft Teams. The summary concludes with a reflection on the video's duration and an invitation for viewers to subscribe for more content.
Mindmap
Keywords
💡Power BI
💡Data Import
💡Data Model
💡Visualizations
💡Filters
💡Power BI Desktop
💡Power Query
💡Publish
💡Data Relationships
💡Dashboards
💡Microsoft Store
Highlights
Introduction to Power BI and its purpose in helping organizations understand data stories and make informed decisions.
Explaining the process of importing data into Power BI, including building a data model and adding visuals and filters.
Guidance on obtaining Power BI from the Microsoft Store and choosing between different options like Power BI for viewing, Power BI Desktop for full functionality, and report builder.
Instructions on installing and launching Power BI Desktop and navigating the initial splash screen.
How to access and import data from various sources, specifically using an Excel workbook as an example.
Demonstration of using the Navigator to assist with importing data into Power BI and previewing data before loading.
Explanation of the options to load data as is or transform the data before importing it into Power BI.
Importing data from an Excel workbook and discussing the automatic detection of relationships between tables by Power BI.
Identifying and resolving data inconsistencies, such as different country name representations, using Power Query Editor.
Removing unnecessary columns from the data and applying transformations without affecting the original data source.
Entering the Data View to examine and clean up data, ensuring consistency and relevance for analysis.
Building a report in Power BI by adding visualizations, starting with a line chart to represent cookies shipped over time.
Customizing visualizations, such as adjusting the Y and X axes, and changing the time scale for better data representation.
Adding secondary Y axes, legends, and formatting options to enhance the visual appeal and clarity of the report.
Creating a card visualization to display total revenue and using table visualizations to show customer information.
Utilizing interactive features to filter data by customer names and see the impact on revenue and cookies shipped.
Adding additional pages to a report for different data views and renaming existing pages for organization.
Publishing the report to the Power BI web service and exploring options for sharing, embedding, and exporting the report.
Encouraging viewers to subscribe for more educational content on using Power BI effectively.
Transcripts
Hi everyone, Kevin here.
Today, we are going to learn how to use
Power BI in just 10 minutes.
All organizations have a
tremendous amount of data,
but what are the
stories behind that data,
and what decisions should
you make based on that data?
Power BI can help us with this.
We'll start with how you
can import data into Power BI.
Then we'll look at how you could build
a data model and start to add
some visuals and also filter your data.
Finally, we'll look at
how you can share out
your reports and dashboards with others.
Let's start with how
you can get Power BI.
To get Power BI,
open up the Microsoft Store and up in the
search field on top,
search for Power BI.
In the results, you'll
see three different options.
Which one should you get?
First, we have Power BI,
and this allows you to view and interact
with existing reports.
Here we have Power BI Desktop,
and this gives you the
full functionality to model
your data and also to build reports.
Lastly, we also have the report builder.
This has much of the functionality that
you'll find in desktop,
but it's not quite as feature rich.
For this video, we're going
to use the desktop experience.
Simply click on this, and right here,
you can click to install or
open if you already
have the app installed.
When you launch Power
BI for the first time,
you'll see this initial splash screen.
Over on the left-hand side,
you can get data and in
a moment we'll do this.
Right down below, you can also access
recent data sources that you've used.
Here, you'll see any
other Power BI reports
that you might have
worked on and you can also
navigate to other reports
that you may have access to.
Over on the right-hand
side, you have all sorts of
different learning resources that are
well worth looking at.
If you don't want to see
this splash screen on launch,
at the very bottom,
you can uncheck this box,
and this will no longer appear.
For now, I'll close this window in the
top right-hand corner.
This drops us into the
main report view in Power BI.
Over on the left-hand side,
here I can see that I
am in the report view.
Currently, we don't
have any data in here yet.
Luckily, it's very easy to get data in.
Right here, we can
add data to our report,
or right up here on the
"Home" tab on the ribbon,
here we also have the
option to import data.
When I click on this "Get Data" dropdown,
you'll see that there are all sorts of
different sources that
you can pull into Power BI.
Chances are, if you have data,
you'll be able to bring it in.
For this video, I'm going to
use data in an Excel workbook.
If you'd like to follow along,
I've included a link to this workbook
down below in the description.
I'll click on this.
Here, I see my workbook.
I'll double-click on this.
This opens up the Navigator,
and this will assist me with
getting my data into Power BI.
Here, I see my Excel workbook name,
and I see that it has two separate tables
and two separate sheets.
You can tell based on this icon here.
I can click into one of these tables,
and here I can preview the data.
There's one table called "Customers,"
and this has all of
the customer information
at the Kevin Cookie Company.
Down below, I also have
order data for orders here
at the Kevin Cookie Company.
Then we also have sheets,
but I only have the table on the sheet,
so there's no other data.
I'll select this table and this table.
Down in the bottom right-hand corner,
we have a few different options.
We can load the data as is.
That means that I don't
want to make any changes to it.
I'll basically bring it in
as it looks right up above.
Alternatively, we can
also transform the data.
Basically, make some modifications.
Maybe we want to clean up the data
before bringing it into Power BI.
You might be wondering,
"Well, why would you
want to transform it here?
"Why not just update
the original Excel sheet?"
In some cases, you
won't have edit abilities
with the original data.
Let's say it's a database,
or maybe someone else
owns the spreadsheet.
In this case, you could edit it
before bringing it to Power BI.
For now, I'll simply click on Load.
Over on the right-hand
side in the data pane,
here I can see that I've successfully
imported these tables
from my Excel workbook.
Here I have all of my orders
and I have all of my
customer information.
Down below, you'll see
all of the different columns
that were contained in the table,
or what we can also refer to as fields.
Over on the left-hand side,
let's now dig into the data
by clicking on this
button for the Data View.
This drops us in the Data View,
and here I can see all of
the different customer data
that's contained
within the Customers table.
Now, there is one issue I noticed.
Here we have a column for a country,
and I say the United
States for a few of these,
but then here it says the U.S.
Ideally, I should clean this up.
I can also click into the Orders table,
and here I can see
all the different orders
that we've had here at
the Kevin Cookie Company.
We've been shipping a lot of cookies.
Right here, there's a
column called Rush Shipments,
and I don't need this for my analysis.
So I think I need to go back
and make a few
refinements to this data here.
Let's click back into the Report View,
and although I loaded the data,
I can still go back
and transform the data.
On the Home tab, over here under Queries,
we can click on Transform
Data and then Transform Data.
This opens up the Power Query Editor,
and we can use Power Query to modify
and also clean the data
before bringing it into Power BI.
One thing to note is this does not at all
affect the original data source.
Think of it as a middle layer
between your original data and Power BI.
Over on the left-hand side,
I can see that there
are two separate queries.
Each one corresponds
with one of the tables
that we would like to bring in,
and the first one is called Customers.
Here, I can see all of the
data contained within customers,
and if I scroll over, here
I see that country column
with the inconsistent
reference to the United States.
I can right-click on the country,
and here there's the
option to Replace Values.
I'll click on this, and I want to look
for references to US,
and I want to replace
that with United States.
I'll click on OK.
Over on the right-hand side,
here I can see a record of
all of the different changes
that I've made.
One of the beautiful things is
as you bring additional
data in in the future,
these same steps will
apply to that new data.
Over on the left-hand side under Queries,
let's now click into Orders,
and here's the column Rush Shipment.
I don't need this for my analysis.
I'll select this column,
and up above, I can remove this column.
Right over here, we see
a category for Transform,
and this has some of the
most popular transformations.
Up on top, I can also
click into Transform here,
and we see lots of different tools
that you can use to
modify and clean up your data.
For now, though, I'm happy
with the way everything looks.
I will click on Home,
and then Close and Apply,
and select this option.
Back in the main report view,
on the left-hand side,
let's now click into the Model view,
and here I can see the data model.
Here I see the two different tables,
and I can also see that Power BI
automatically detected the relationship
between these two tables.
The Customers table has a customer ID,
and the Orders table
also has a customer ID.
If, for whatever reason, Power BI
did not detect the relationship,
you can simply drag
an item from one table
over onto the other table,
and that will establish a relationship
between these tables.
Let's now go back into the report view,
and let's start
building out a nice report.
Back now within the report view,
I want to pull together a report,
and a report is simply a collection
of different visualizations.
Over here on the right-hand side,
you can see all of the
different visualizations
that you get with Power BI.
I want to show cookies shipped over time,
and I think a line chart would work
really well for that.
To insert one of these visualizations,
here I simply click on a line chart,
and here it places a
placeholder in my report.
Over on the right-hand side,
here I see all of my
data that I brought in,
and I want to show cookies shipped.
Here in my Orders table,
there's an option called Cookies Shipped.
I can take this item,
and I can drag it in,
and I'll place it on the Y axis.
So there it shows up right here,
but I also want to show it over time.
Over on the right-hand
side in the Orders table,
I also have the order date.
I can press and hold on this,
and I will drag this into the X axis.
And once I place that,
you'll see the line
chart start taking shape.
I can click on this handle,
and I can drag it so it's larger.
I can even reposition it
in whatever spot I want.
Right now it shows orders shipped by day,
but it's a little hard to
make sense of what's going on.
When I click on this, down below,
I have these different
options where I can drill up.
So instead of viewing
it on a daily basis,
instead I could view it on a
monthly and a yearly basis,
and this now looks really nice.
Over on the right-hand side,
again, under Visualizations,
if I scroll down, I
have different options.
I can add a secondary Y axis.
I can pull in a legend.
If we go up to the top, here I
could also format the visual.
So here I have a few different options,
and right up under General,
here I could also adjust some of the
different properties.
For example, the title.
Currently it says sum of cookies shipped.
Maybe I just want it to
say cookie shipped by date.
If we go down to, I
could also adjust things
like the text color, and let
me go with this blue color.
That matches the Kevin
Cookie Company theme color.
To exit out of this view,
I'll simply click on the report,
and that brings me
back to this base state.
I want to add some
additional visuals to this report,
and I'd like to show the total revenue
that we've earned here at
the Kevin Cookie Company.
Of course, I could come in here
and I could choose one of these visuals,
or I could simply go down to the data,
and here I'll check revenue.
And this
automatically inserts a bar chart.
It makes a best guess for
what visual would work well,
but I can still modify this if I want.
Over on the right-hand
side, with this visual selected,
here I'll select a card,
and instead of showing a bar chart,
it now shows a total
revenue of six million.
Like I've always said,
there's a lot of money
in the cookie business.
I'd like to include one more visual
that shows all of our customers
here at the Kevin Cookie Company.
Over on the right-hand side,
I'll check the box next to customer name,
and here it automatically
inserts a table visualization.
One of the really neat things is
I can click on any one
of these customer names.
So let's say Acme grocery stores,
and that automatically
filters this line chart
and this card.
Remember, we connected
these two separate tables.
So here when I choose a customer name,
it knows what revenue,
and also the cookie shipped associated
with that customer name.
That's pretty cool.
I can also press the control key,
and I can multi-select customers.
So let's say I want to see the revenue
for these three customers.
It looks like it was four million.
To turn off this filter,
I simply click on the
side of the visualization,
and it goes away.
This report is coming together nicely,
but I may want to add some additional
pages in the future,
maybe for different views of the data.
Down below, I could simply double-click,
and I could rename the
page that I'm currently on,
and I could click on this plus icon
to add additional pages.
For now though, I'd like to
share this out with the team,
just to start getting
some feedback from them.
Up on the top ribbon,
over on the right-hand side,
there's the option to publish.
Let's click on that.
Before we can publish,
we'll need to save changes.
I'll click on save.
For the destination,
I'll select my workspace,
and then click on select.
And look at that success.
Right over here, we can now open this
on the Power BI web service.
And check that out.
I now see my report on
the Power BI web service.
In the top left-hand corner,
I can click on the file menu.
I can embed this report on a
SharePoint site, on a website.
I could also generate a QR code
that will lead people
directly to this page.
Up on top, I can also
export directly to a PowerPoint.
I could even embed live data.
I could export a PDF.
I could also share it.
Here, I could type in an
email address or copy a link.
And over here, I could
even place it directly
in a Microsoft Teams chat.
All right, well, it took
slightly longer than 10 minutes,
but hopefully that gives
you enough to start exploring
and building that muscle in this
fantastic analytics tool.
To watch more videos like this one,
please consider subscribing,
and I'll see you in the next video.
Browse More Related Video
Introduction to Power BI: What is it?
Interactive Excel Dashboard Tutorial in 3 Steps (+ FREE Template)
How to install MongoDB 6 on Ubuntu 22.04 LTS Linux
Part 1- End to End Azure Data Engineering Project | Project Overview
ATLAS Tutorial: Data Sources - Dashboard
Microsoft Power Apps for Beginners From Idea to App!
5.0 / 5 (0 votes)