Applying MLE for estimating the variance of a time series
Summary
TLDRIn this video, the presenter revisits forecasting gold prices using Dynamic Linear Models (DLM) with a twist—estimating variances using Maximum Likelihood Estimation (MLE). After explaining the theory behind DLM and MLE, they apply it to a one-year dataset, highlighting the process of variance estimation and model building. The presenter shows how to filter and forecast using the estimated variances, but notes that MLE's estimates don't always improve the forecast's accuracy. They also touch on alternative methods like Bayesian techniques and Gibbs sampling for variance estimation. The video concludes with a call to action for viewers to subscribe.
Takeaways
- 😀 The video demonstrates predicting gold prices using Dynamic Linear Models (DLMs) while estimating unknown variances.
- 📊 DLMs consider time series data in two hierarchies: observational level and system level, each with its own variance.
- 🧮 Maximum Likelihood Estimation (MLE) is used to estimate variances before building the DLM for forecasting.
- 💻 In R, the `dlm` package is used for modeling, `dplyr` for data preprocessing, and `ggplot2`/`plotly` for visualization.
- 📅 The data covers June 27, 2022, to June 23, 2023, consisting of 250 business days, excluding weekends and U.S. holidays.
- 📈 Time series visualization includes high prices in blue, low prices in red-orange, and shaded areas representing price ranges.
- 🔍 Variances are estimated separately for high and low prices, with observational and system-level components considered.
- 📉 Filtering (`dlmFilter`) updates state estimates, while forecasting (`dlmForecast`) predicts future gold prices based on the model.
- ⚠️ MLE-based variance estimation did not significantly improve forecast accuracy compared to actual prices, suggesting model complexity or alternative methods may be needed.
- 📚 Bayesian methods like Gibbs sampling are recommended for variance estimation, especially for non-normal data distributions.
- 💾 All R code demonstrated in the video is available on GitHub for reproducibility and further experimentation.
- 🎯 The video encourages viewers to subscribe to the channel 'Timely Time Series' for more tutorials on time series analysis.
Q & A
What is a Dynamic Linear Model (DLM) and how is it used in forecasting?
-A Dynamic Linear Model (DLM) is a state-space model used to analyze and forecast time series data. It breaks down the time series into two levels: the observational level (which models the observed data) and the system level (which models the underlying process). DLMs are useful for making predictions when the underlying process is dynamic, and they incorporate both trend and seasonal effects.
Why is variance estimation important in the context of Dynamic Linear Models?
-Variance estimation is crucial because it helps to quantify the uncertainty in both the observational and system-level processes of the DLM. Without accurate variance values, the forecasts generated by the model may be unreliable. In this video, the goal is to estimate the variances using Maximum Likelihood Estimation (MLE) to improve forecast accuracy.
What are the two types of variances that need to be estimated in a DLM?
-In a Dynamic Linear Model, there are two types of variances that need to be estimated: 1) **Observational variances**: These describe the variance of the observed data (high price and low price). 2) **System-level variances**: These describe the variance of the underlying model that drives the observed data (again, for both high and low prices).
What is Maximum Likelihood Estimation (MLE) and how does it apply to variance estimation in DLM?
-Maximum Likelihood Estimation (MLE) is a statistical method used to estimate parameters (in this case, variances) by maximizing the likelihood function. The likelihood function measures the probability of observing the data given certain parameter values. In the DLM context, MLE is used to estimate variances by finding the values that make the observed data most probable, based on the model assumptions.
Why is the log-likelihood function used in the estimation process instead of the likelihood function directly?
-The log-likelihood function is used because it simplifies the process of differentiation. The likelihood function involves a product of probabilities, and taking the logarithm of this product transforms it into a sum, which is easier to differentiate. This is particularly useful when maximizing the likelihood to find the optimal variance values.
What are the advantages of using the Gaussian distribution in DLM for variance estimation?
-The Gaussian distribution assumption simplifies the estimation process, as it has well-known properties and is computationally efficient. By assuming that the observations follow a Gaussian (normal) distribution, the model can use standard methods like Maximum Likelihood Estimation (MLE) to estimate the variances, which makes the process more manageable and interpretable.
What is the role of the Hessian matrix in Maximum Likelihood Estimation?
-The Hessian matrix is the second derivative of the log-likelihood function, and it provides information about the curvature of the function. In MLE, it is used to assess the variance of the estimated parameters (in this case, the variances). By evaluating the Hessian matrix, we can better understand the uncertainty of the variance estimates, though this step is not explored in detail in the video.
What is the purpose of the `dlmMLE` function in R, and how does it work?
-The `dlmMLE` function in R is used to estimate the variances in a Dynamic Linear Model. It takes a model-building function (such as the `build` function) and uses optimization techniques to find the values of the variances that maximize the log-likelihood. The function relies on `optim`, an optimization routine in R, to perform this maximization automatically.
What were the results of variance estimation for the high and low prices in the video?
-The estimated variance for the high price series was very small (0.0017), whereas for the low price series, the estimated variance was larger (2.43). The system-level variances were also different: 225.399 for the high price and 216.7621 for the low price. These values were significantly different from the assumed variances in the previous video, highlighting the impact of estimating the variances.
Why did the forecast accuracy not improve despite estimating the variances using MLE?
-Although MLE provided better estimates for the variances, the forecast accuracy did not improve in this case. This suggests that the DLM with MLE may not be complex enough to accurately predict the prices in this particular scenario. The model might require additional complexity, or a different technique (e.g., Bayesian methods like Gibbs sampling) may be necessary for better accuracy, especially if the data distribution is not Gaussian.
What are the two alternative methods mentioned in the video for estimating variances, and when might they be useful?
-The two alternative methods for estimating variances mentioned in the video are: 1) **Gibbs sampling**: A Bayesian technique that is useful when the data distribution is not normal or if more complex models are needed. 2) **Bayesian statistics**: A framework that allows for incorporating prior knowledge and uncertainty, which could be helpful if MLE is not yielding satisfactory results.
Outlines

This section is available to paid users only. Please upgrade to access this part.
Upgrade NowMindmap

This section is available to paid users only. Please upgrade to access this part.
Upgrade NowKeywords

This section is available to paid users only. Please upgrade to access this part.
Upgrade NowHighlights

This section is available to paid users only. Please upgrade to access this part.
Upgrade NowTranscripts

This section is available to paid users only. Please upgrade to access this part.
Upgrade NowBrowse More Related Video
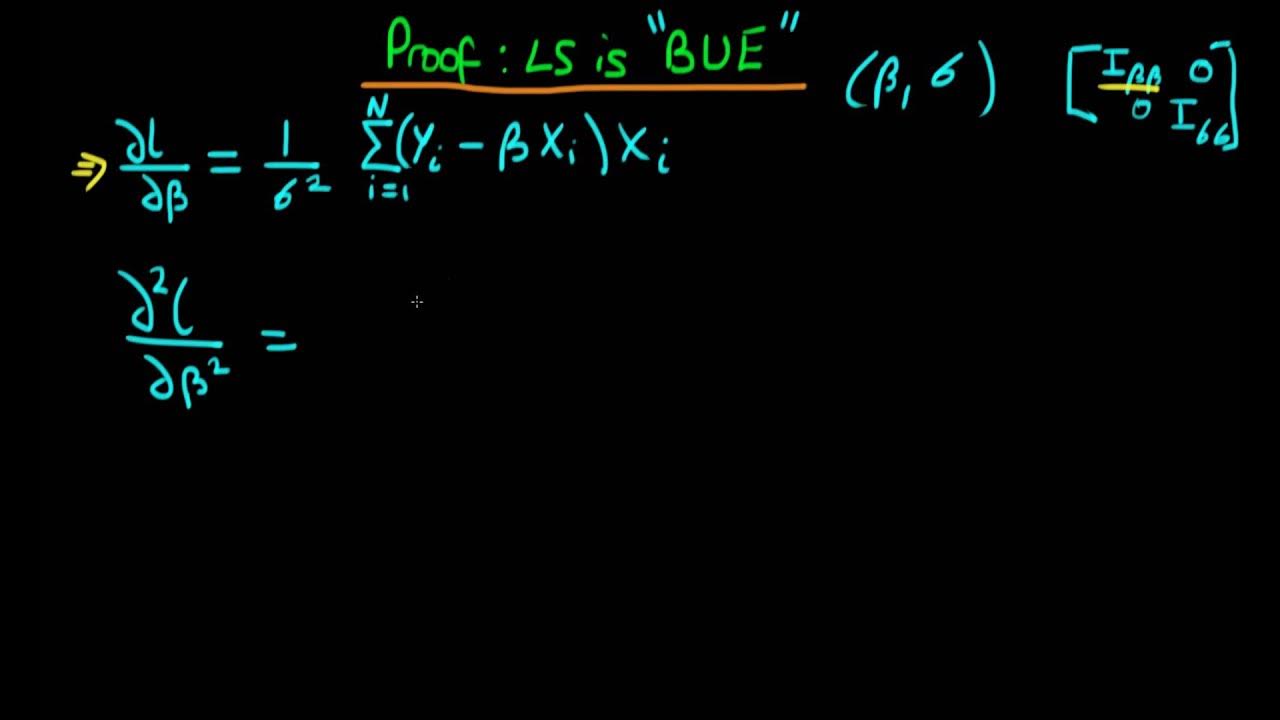
Least squares comparison with Maximum Likelihood - proof that OLS is BUE
Presentation16: Using Maximum Likelihood Estimation to Calibrate a Discrete Time Markov Model

Lec-5: Logistic Regression with Simplest & Easiest Example | Machine Learning
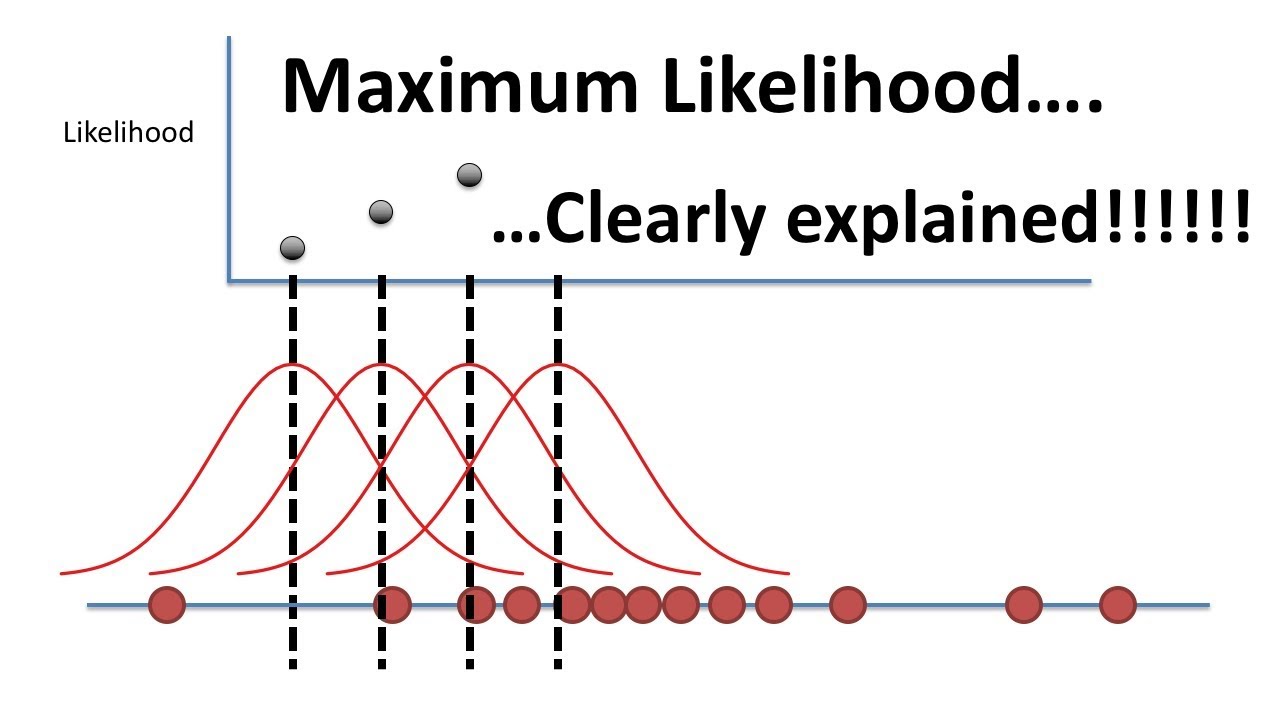
Maximum Likelihood, clearly explained!!!
Maximum Likelihood Estimation (Part 1)
Bayesian Estimation in Machine Learning - Maximum Likelihood and Maximum a Posteriori Estimators
5.0 / 5 (0 votes)