Image Processing with OpenCV and Python
Summary
TLDRIn this tutorial, Rob, a data scientist, provides an introduction to working with image data in Python using Matplotlib and OpenCV. He walks through key concepts such as loading images, understanding image arrays, and visualizing RGB channels. Rob also covers common image manipulations like resizing, converting to grayscale, and applying filters such as blurring and sharpening. By the end of the video, viewers will have a solid foundation in handling image data and performing essential operations, making it ideal for both beginners and those interested in machine learning applications.
Takeaways
- 😀 Python's image manipulation capabilities are powerful, from basic tasks like cropping to complex machine learning applications.
- 😀 Libraries like Matplotlib and OpenCV are essential tools for working with image data in Python, each offering unique functionalities.
- 😀 Images in Python are represented as NumPy arrays, with the three main dimensions being height, width, and color channels.
- 😀 Matplotlib and OpenCV interpret image color channels differently: Matplotlib uses RGB (Red, Green, Blue), while OpenCV uses BGR (Blue, Green, Red).
- 😀 When reading an image, the data is stored as a 3D NumPy array with dimensions representing height, width, and color channels.
- 😀 You can visualize the distribution of pixel values within an image using histograms to better understand the image's characteristics.
- 😀 Image channels (Red, Green, and Blue) each contain intensity values that contribute to the final color representation of the image.
- 😀 OpenCV provides functions for various image manipulations, such as converting images to grayscale, resizing, and applying filters.
- 😀 Image resizing can be achieved using OpenCV’s resize function, with different interpolation techniques available for upscaling or downscaling images.
- 😀 Images can be saved in different formats (e.g., PNG, JPG) using either Matplotlib or OpenCV, allowing for flexible output options after manipulation.
Q & A
What are the two main Python libraries used for working with image data in the tutorial?
-The two main Python libraries used in the tutorial are Matplotlib and OpenCV (cv2). Matplotlib is used for visualizing and displaying images, while OpenCV is used for image manipulation and processing.
How does Matplotlib and OpenCV handle image data differently?
-Matplotlib loads images in RGB format, while OpenCV loads images in BGR format. This difference in color channel ordering can cause color mismatches when displaying images using both libraries.
What is the structure of the NumPy array representing an image?
-The NumPy array representing an image has three dimensions: height, width, and channels. The channels typically represent the color channels (RGB or BGR), with each pixel having intensity values corresponding to these channels.
What is the purpose of using the `glob` package in the script?
-The `glob` package is used to list all the image files (in this case, cat and dog images) in a directory, allowing the script to easily access and process the image files by their file paths.
Why is it important to understand the shape of the NumPy array when working with images?
-Understanding the shape of the NumPy array is crucial because it gives insight into the structure of the image data, specifically the image's dimensions (height, width) and the number of color channels. This helps in image manipulation tasks like resizing or processing each channel individually.
What is the range of pixel values in most images, and how can these values be normalized?
-The pixel values in most images range from 0 to 255. To normalize the values, they can be divided by 255, resulting in values between 0 and 1. However, working with values between 0 and 255 is common in many image processing tasks.
How can you display individual color channels of an image using Matplotlib?
-You can display individual color channels (Red, Green, Blue) by extracting each channel from the image array and using color maps (e.g., 'reds', 'greens', 'blues') to visualize each channel separately.
What does the `cv2.cvtColor()` function do in OpenCV?
-The `cv2.cvtColor()` function is used to convert images from one color format to another. For example, it can convert an image from BGR (OpenCV's default format) to RGB (Matplotlib's expected format) to correct color mismatches when displaying images.
How can you convert an image to grayscale in OpenCV?
-To convert an image to grayscale in OpenCV, you can use the `cv2.cvtColor()` function with the `cv2.COLOR_RGB2GRAY` argument, which will reduce the image from three channels (RGB) to a single intensity channel.
What are some common image manipulations you can perform with OpenCV, as demonstrated in the tutorial?
-Some common image manipulations include resizing images (with `cv2.resize()`), converting to grayscale, applying filters (such as blurring or sharpening), and adjusting the image's color channels. These manipulations are useful for tasks like preprocessing images for machine learning models.
Outlines

This section is available to paid users only. Please upgrade to access this part.
Upgrade NowMindmap

This section is available to paid users only. Please upgrade to access this part.
Upgrade NowKeywords

This section is available to paid users only. Please upgrade to access this part.
Upgrade NowHighlights

This section is available to paid users only. Please upgrade to access this part.
Upgrade NowTranscripts

This section is available to paid users only. Please upgrade to access this part.
Upgrade NowBrowse More Related Video

TEKNIK CLUSTERING UNTUK MENGANALISA DATA MAHASISWA
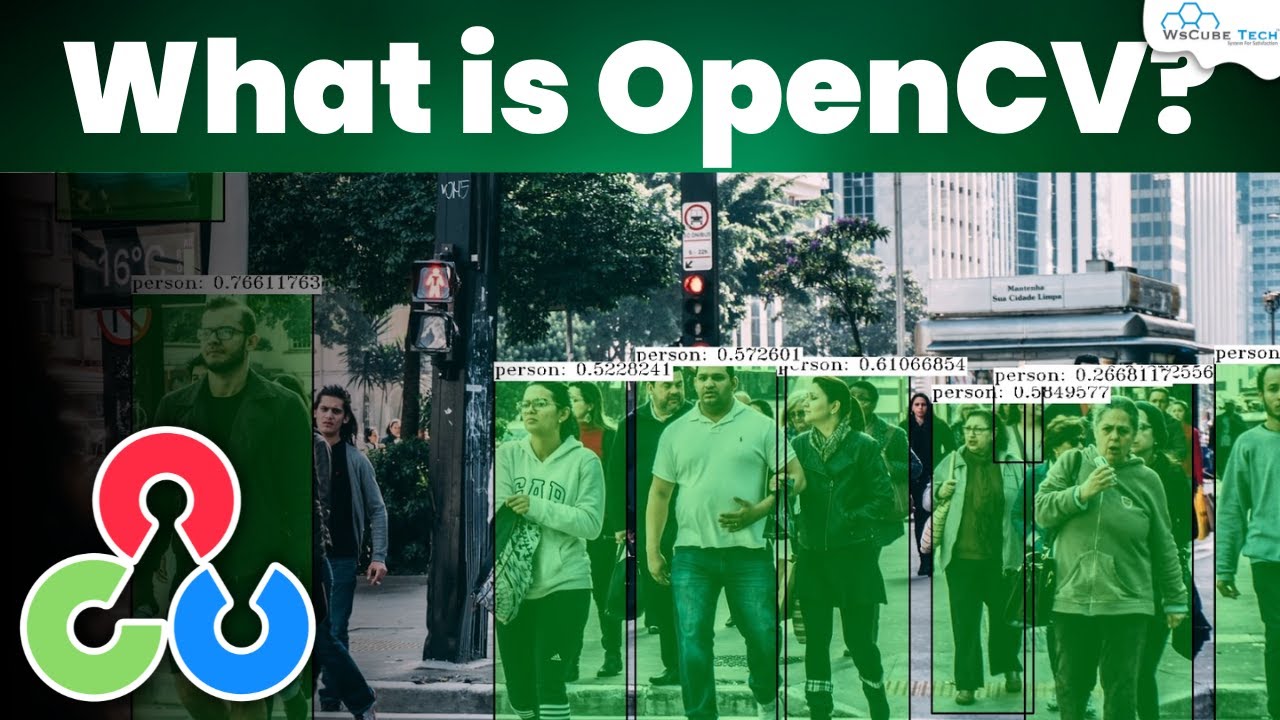
What is OpenCV with Python🐍 | Complete Tutorial [Hindi]🔥

Video Materi Pengenalan Visualisasi Data
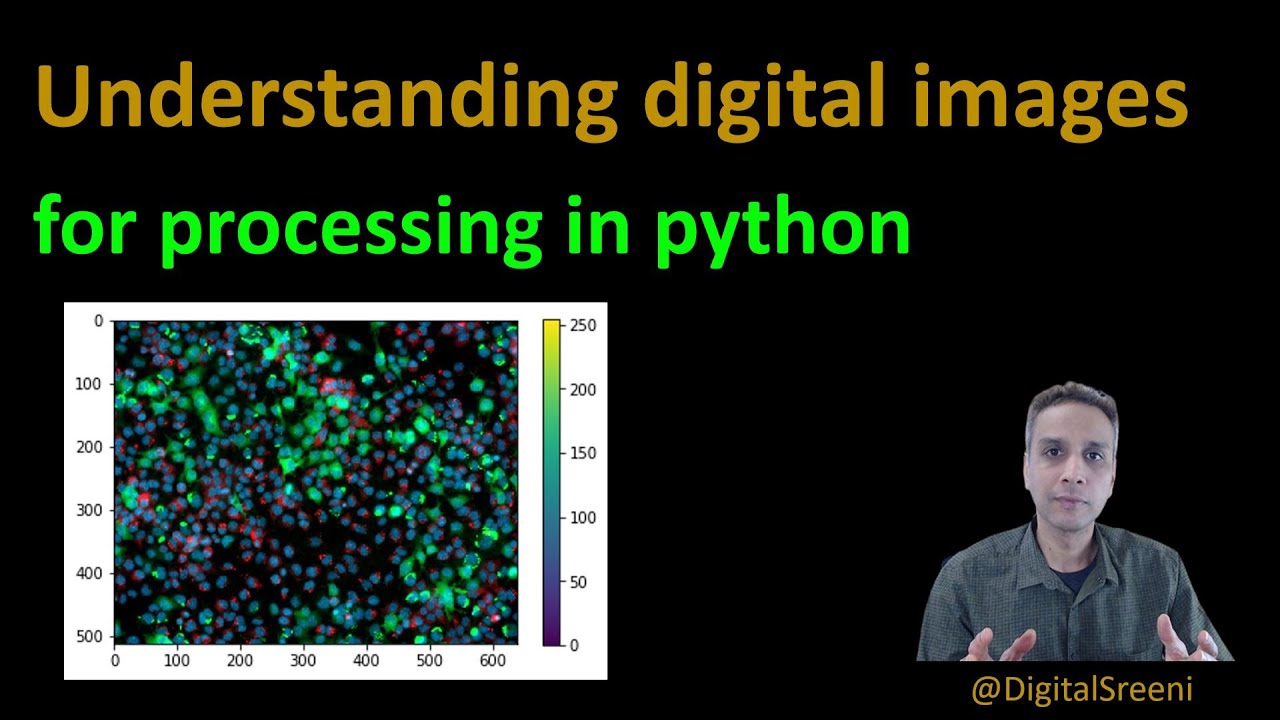
16 - Understanding digital images for Python processing
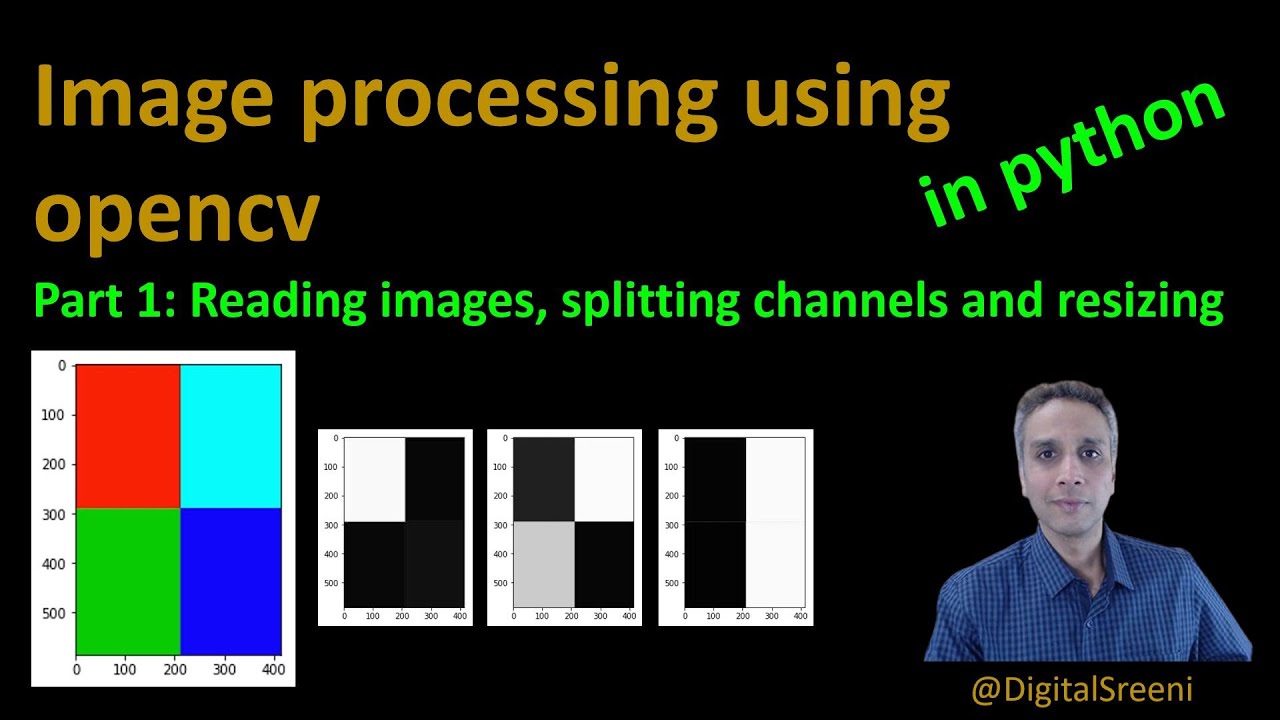
25 - Reading Images, Splitting Channels, Resizing using openCV in Python

Introduction - Data Analysis with Python
5.0 / 5 (0 votes)