Video Materi Pengenalan Visualisasi Data
Summary
TLDRIn this computer security class video, the instructor introduces data visualization using the popular Python library Matplotlib. Students are guided on how to install Matplotlib and start creating various visualizations such as line plots, scatter plots, bar charts, histograms, and more. The video explains how to customize visualizations by adjusting colors, axis scales, and adding text. The instructor emphasizes the power of Matplotlib for scientific and data-driven projects, offering a free alternative to paid software. The video serves as an introduction, with a follow-up tutorial to deepen the understanding of the library's features.
Takeaways
- 😀 The class is being conducted asynchronously, with videos to watch and assignments or post-tests to complete.
- 😀 The topic for this session is data visualization using the Matplotlib library in Python programming.
- 😀 Matplotlib is a popular library for creating static, animated, and interactive visualizations.
- 😀 Matplotlib simplifies creating data visualizations, making easy tasks easier and complex tasks possible.
- 😀 Matplotlib can be used for scientific publications without requiring expensive software like Origin Pro.
- 😀 Proficiency in Matplotlib allows users to create descriptive curves, offering more flexibility compared to Excel.
- 😀 This video is an introduction, and a follow-up tutorial video will provide hands-on learning.
- 😀 Installation of Matplotlib can be done via 'pip install matplotlib' in an IDE like VS Code or Jupyter Notebook.
- 😀 Google Colab can be used if you encounter difficulties with installations or lack a local setup.
- 😀 Matplotlib supports various types of plots, including line plots, scatter plots, bar plots, histograms, box plots, and pie charts.
- 😀 The library allows customization, such as adjusting colors, axis scales, adding text, and incorporating other features for more dynamic visualizations.
Q & A
What is the main topic of today's class?
-The main topic of today's class is data visualization using the Matplotlib library in Python.
Why is Matplotlib considered a popular tool for data visualization?
-Matplotlib is popular because it is a comprehensive library that allows you to create static, animated, and interactive plots, making it suitable for a wide range of data visualization tasks, especially for scientific publications.
How can students install Matplotlib for this course?
-Students can install Matplotlib by running the command 'pip install matplotlib' in Python IDEs such as VS Code or Jupyter Notebook. Alternatively, they can use Google Colab if they encounter issues during installation.
What are some of the types of plots that can be created using Matplotlib?
-Matplotlib can be used to create various types of plots such as line plots, scatter plots, bar plots, histograms, box plots, pie charts, and more advanced statistical plots like violin plots.
What is the advantage of using Matplotlib over other software like Origin Pro?
-The advantage of using Matplotlib over software like Origin Pro is that Matplotlib is free, while Origin Pro is paid. Matplotlib allows users to create high-quality visualizations without the need for expensive software.
What environments can be used to run Python code with Matplotlib?
-Python code with Matplotlib can be run in environments such as VS Code, Jupyter Notebook, or Google Colab. Google Colab provides a free hosted environment for running Python code.
What is the significance of Matplotlib being able to create both static and interactive visualizations?
-The ability to create both static and interactive visualizations makes Matplotlib a versatile tool for data analysis and presentation. It allows users to choose the type of visualization that best fits their needs, whether for static reports or interactive data exploration.
Can students access this course material on devices other than a laptop?
-Yes, students can access this course material on other devices, as long as they have internet access and a device capable of running Python, or they can use someone else’s laptop to complete the course tasks.
What will be covered in the second video of the course?
-In the second video, a tutorial will be provided, demonstrating how to use Matplotlib in more practical scenarios. This will help students get hands-on experience with creating various plots.
How should students proceed if they are unfamiliar with using Matplotlib?
-Students should try to install Matplotlib and experiment with different plot types as shown in the introductory video. By practicing and exploring the different features, they will become more familiar with the library and its capabilities.
Outlines

This section is available to paid users only. Please upgrade to access this part.
Upgrade NowMindmap

This section is available to paid users only. Please upgrade to access this part.
Upgrade NowKeywords

This section is available to paid users only. Please upgrade to access this part.
Upgrade NowHighlights

This section is available to paid users only. Please upgrade to access this part.
Upgrade NowTranscripts

This section is available to paid users only. Please upgrade to access this part.
Upgrade NowBrowse More Related Video

Construindo Plots com Matplotlib em Python
Data Visualization Tutorial For Beginners | Big Data Analytics Tutorial | Simplilearn

Matplotlib vs. Plotly: The Ultimate SHOWDOWN of Python Data Visualization Giants | Episode #13
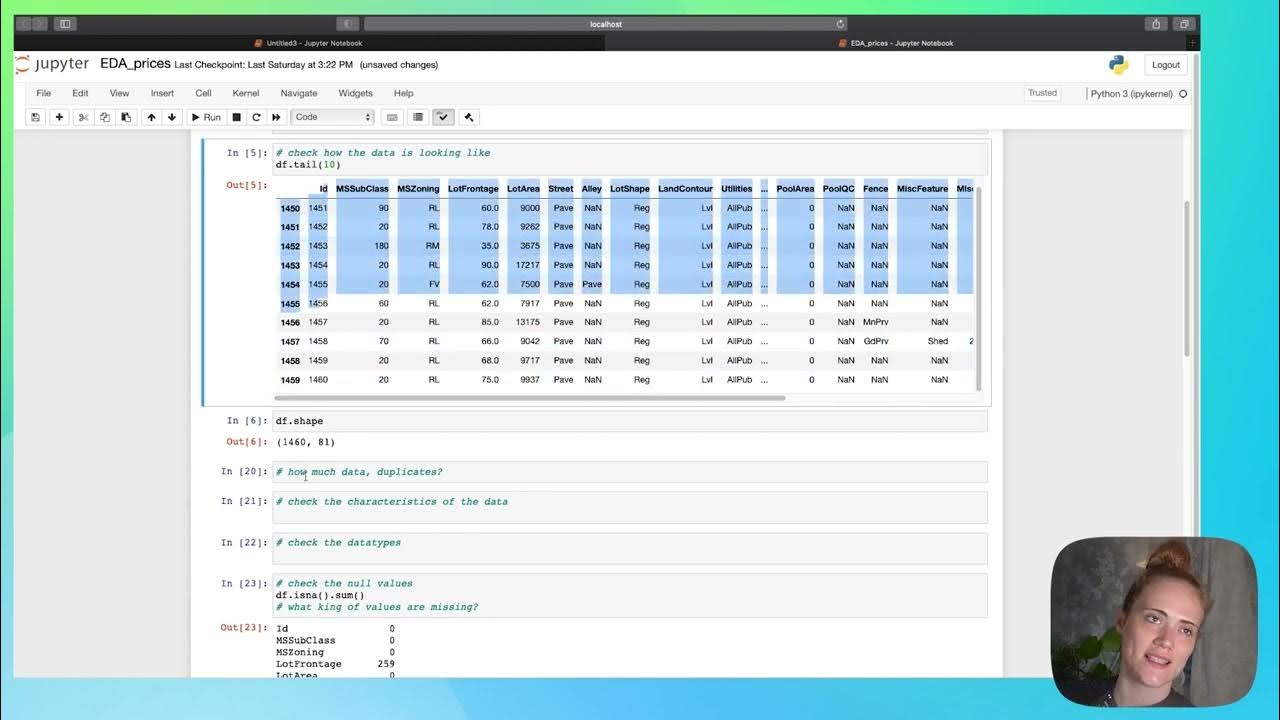
EDA - part 1

O Que é e Como Criar Gráfico de Barras com Matplotlib em Python?

7 Python Data Visualization Libraries in 15 minutes
5.0 / 5 (0 votes)