NVDA Stock - Crucial NVIDIA Levels Here
Summary
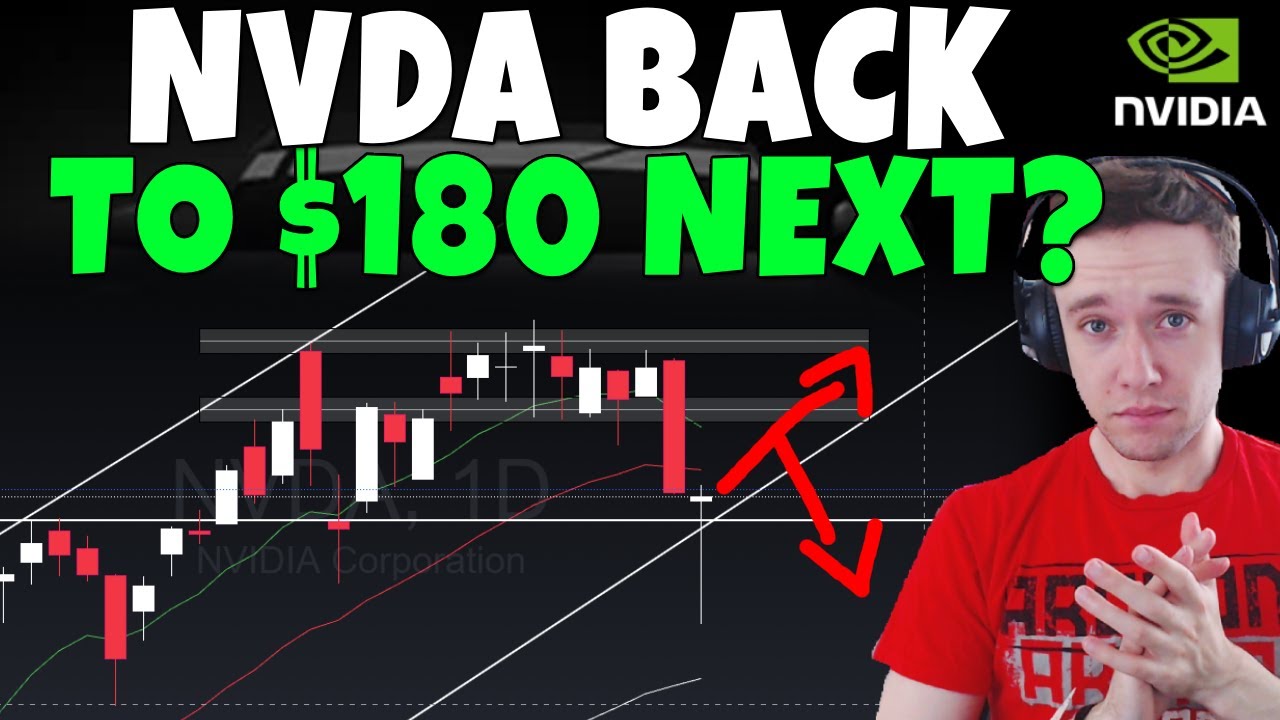
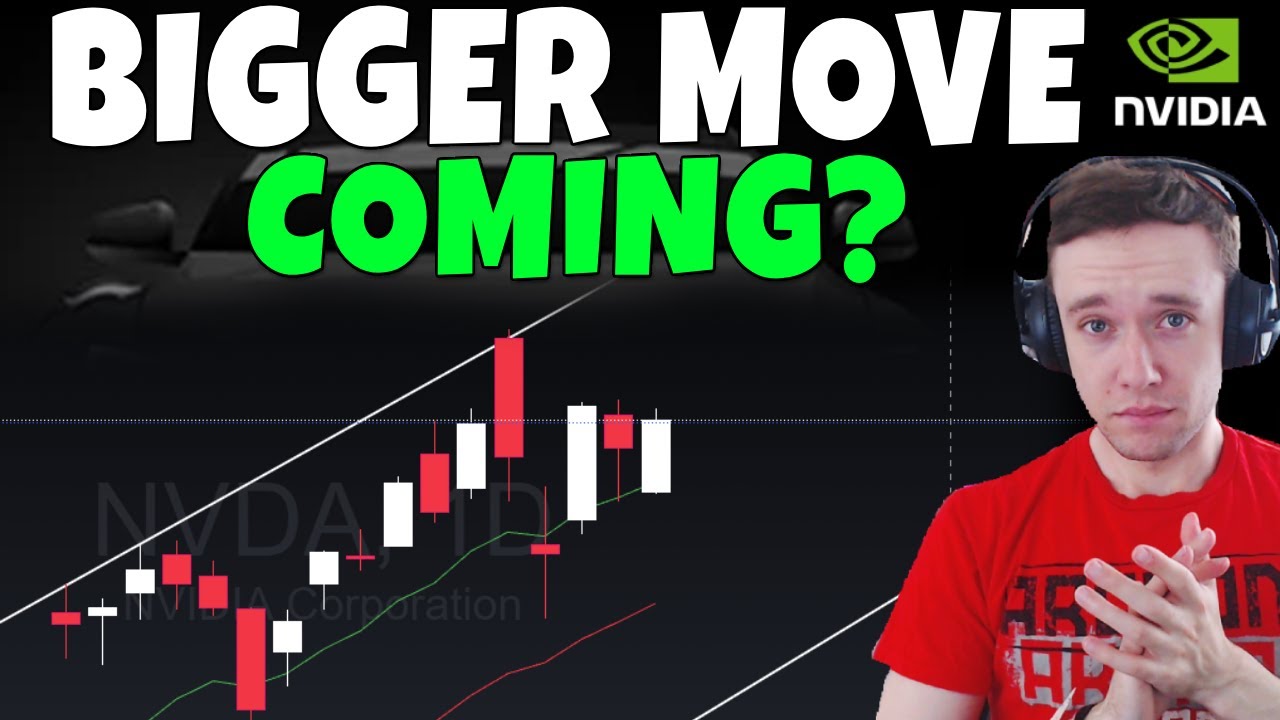
TLDRIn this Nvidia daily update, the host discusses recent movements in Nvidia’s stock, analyzing key technical levels and patterns. After a slight 1.5% gain, the stock closed at $145, a crucial resistance point. The video highlights key support zones around $142 and $145, along with potential breakout and breakdown scenarios. The host also warns about the possibility of a liquidity sweep, drawing parallels to Tesla’s past movements. The analysis emphasizes patience, with a focus on whether Nvidia holds key support levels and the potential for a larger move in the future.
Takeaways
- 😀 Nvidia stock has been showing some movement, closing at a key resistance level of 145, and the analysis revolves around how the stock behaves in the coming days.
- 😀 The stock has been moving in a descending channel pattern, and a breakout occurred before reaching a resistance point at 145, which will be critical for determining future movement.
- 😀 Important support has been found at 142, where the stock has bounced multiple times, and this level needs to hold for bullish momentum to continue.
- 😀 If Nvidia opens above 145, this could turn into a new support zone, potentially leading to a target around 147, but any reversal under 145 would signal a bearish move.
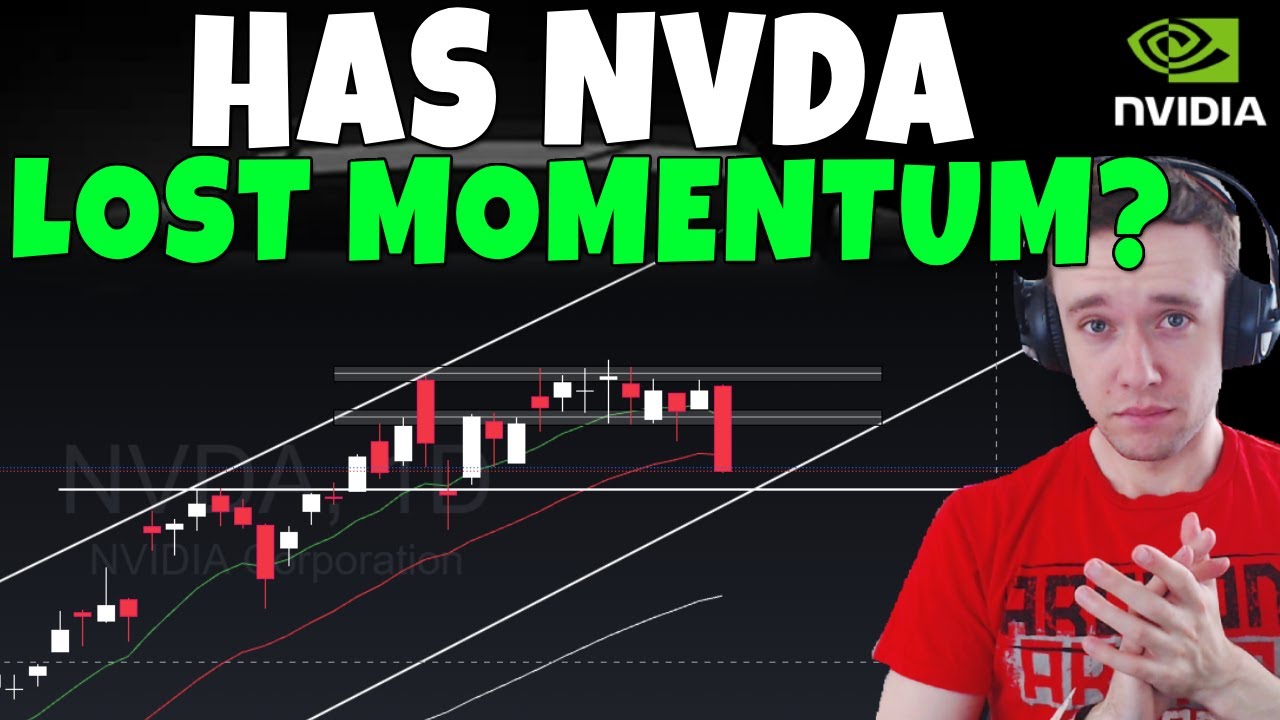
- 😀 A close below the trend line and the 8 exponential moving average (EMA) could indicate the potential loss of bullish momentum, while bouncing off the 142 zone is a positive sign.
- 😀 Watch for potential false breakouts around the 145 level, which could trap traders and lead to a sharp drop, similar to past occurrences with other stocks like Tesla.
- 😀 Nvidia's stock could face a liquidity sweep, where it temporarily breaks above key levels (like 145), only to pull back sharply afterward, so caution is advised.
- 😀 A close below 142 would be concerning, and further weakness could lead to a decline toward the high 130s, with the worst-case scenario seeing a drop to 123.
- 😀 The Bollinger Bands are at the top, suggesting limited upside in the short term, though long-term prospects for Nvidia remain positive if the stock resets to a stronger support zone.
- 😀 The script advises patience, as trading Nvidia right now is less enticing due to potential risks, with better opportunities likely present in other stocks.
Q & A
What is the current situation with Nvidia's stock price according to the video?
-Nvidia's stock closed at $145, up 1.5%. However, the stock is still within the same range and is facing resistance around the $145 level.
What is the significance of the $142 level for Nvidia's stock?
-The $142 level has been a key support zone for Nvidia. Every time the stock drops to this level, it has bounced back, making it crucial for the bulls to maintain this support for continued upward movement.
What potential scenario does the video warn about for Nvidia's stock?
-The video warns about a potential false breakout scenario, where Nvidia might break above the $145 level, only to fall back below it, which would be considered a bearish signal and could result in a significant downward movement.
What are the key checkpoints to monitor for Nvidia's stock momentum?
-The key checkpoints are: 1) Losing the trend line, 2) Losing the 8 exponential moving average (EMA) support, and 3) Losing the $142 support level and closing below it.
What happened when Nvidia bounced off the 8 EMA at $142?
-Nvidia bounced off the 8 EMA, which coincided with the $142 support level, suggesting strong support at that area. This bounce indicates that the bulls are still in control at this level.
How does the video describe Nvidia’s recent price action?
-The video describes Nvidia’s price action as somewhat stagnant, with minor upward movement, and indicates that the stock is not making substantial moves in the short term, remaining within a range.
What are the potential targets for Nvidia’s stock if the price moves higher?
-If Nvidia moves higher, the target could be in the range of $147 to $149, potentially hitting a fair value gap in that zone.
What is a liquidity sweep, and why is it important for Nvidia's stock?
-A liquidity sweep refers to a situation where a stock momentarily breaks above resistance or below support, only to quickly reverse direction. The video warns that Nvidia could experience such a scenario, similar to what happened with Tesla, where the price breaks above resistance but then sharply drops.
What is the significance of the Bollinger Bands in the analysis?
-The Bollinger Bands show that Nvidia is at the top of the bands, indicating that the stock might be running out of short-term upward momentum. While the stock could go higher, the video suggests that there might not be much room left for further price gains.
What is the general outlook for Nvidia’s stock in the long term?
-The long-term outlook for Nvidia’s stock is positive. The video suggests that while short-term movement may be limited, the stock is expected to rise in the long run as it breaks through major support levels and enters more bullish territory.
Outlines

This section is available to paid users only. Please upgrade to access this part.
Upgrade NowMindmap

This section is available to paid users only. Please upgrade to access this part.
Upgrade NowKeywords

This section is available to paid users only. Please upgrade to access this part.
Upgrade NowHighlights

This section is available to paid users only. Please upgrade to access this part.
Upgrade NowTranscripts

This section is available to paid users only. Please upgrade to access this part.
Upgrade Now


5.0 / 5 (0 votes)