SPSS : Uji t, Uji F dan Koefisien Determinasi dalam Analisis Regresi Berganda
Summary
TLDRIn this video, Mita Kartika explains multiple linear regression analysis, focusing on how independent variables (X1, X2) affect the dependent variable (Y). She covers hypothesis testing, including t-tests for individual variables and the F-test for simultaneous effects. Mita walks through SPSS procedures to run these tests and interpret the results. Key points include understanding p-values, t-values, F-values, and R-squared values to evaluate the strength of variable relationships. The tutorial provides practical steps for interpreting statistical outputs and making informed conclusions in regression analysis.
Takeaways
- 😀 Multiple regression analysis aims to understand the effect of independent variables (X) on the dependent variable (Y).
- 😀 The t-test assesses the **individual** impact of each independent variable on the dependent variable, checking for a **partial** effect.
- 😀 The F-test evaluates the **simultaneous** impact of all independent variables together on the dependent variable.
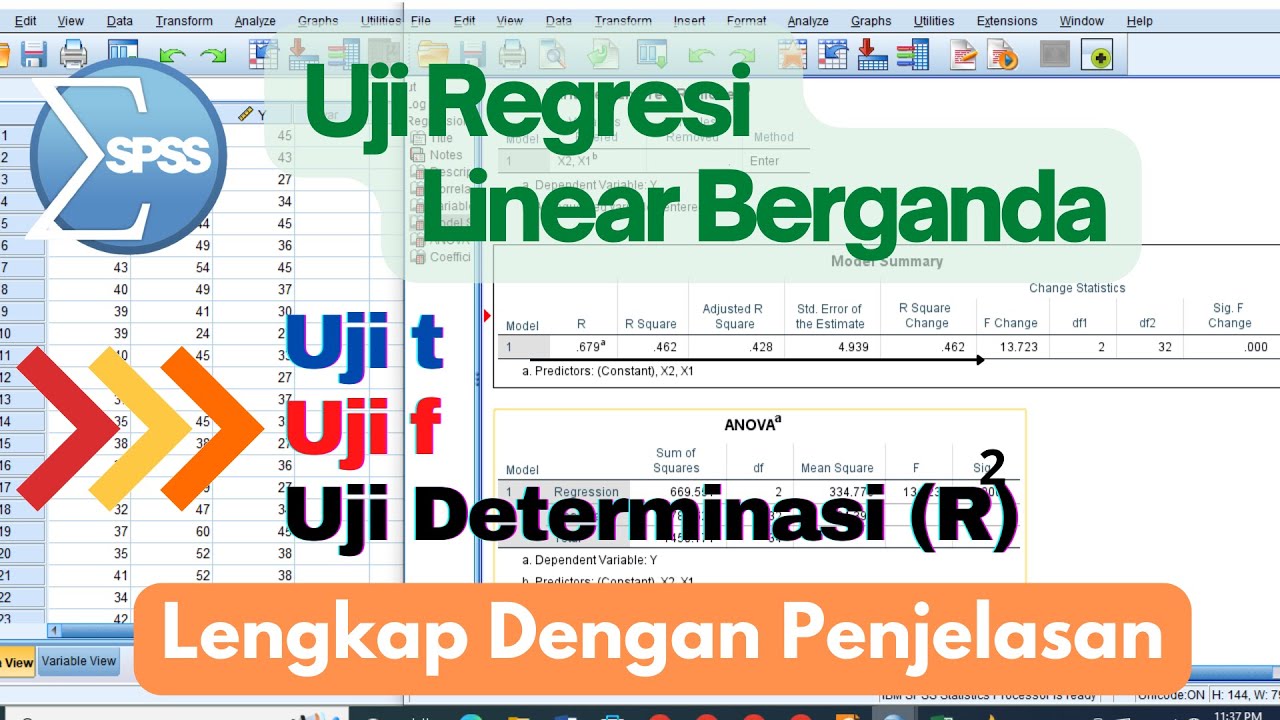
- 😀 The coefficient of determination (R-squared) shows the percentage of the variance in the dependent variable explained by the independent variables.
- 😀 If the significance value in a t-test is less than 0.05 or the t-statistic is greater than the t-table value, the independent variable has a significant impact on Y.
- 😀 Similarly, in an F-test, if the significance value is less than 0.05 or the F-statistic exceeds the F-table value, the independent variables significantly influence Y.
- 😀 The hypothesis testing process involves comparing t-hitung and t-table for the t-test and f-hitung and f-table for the F-test.
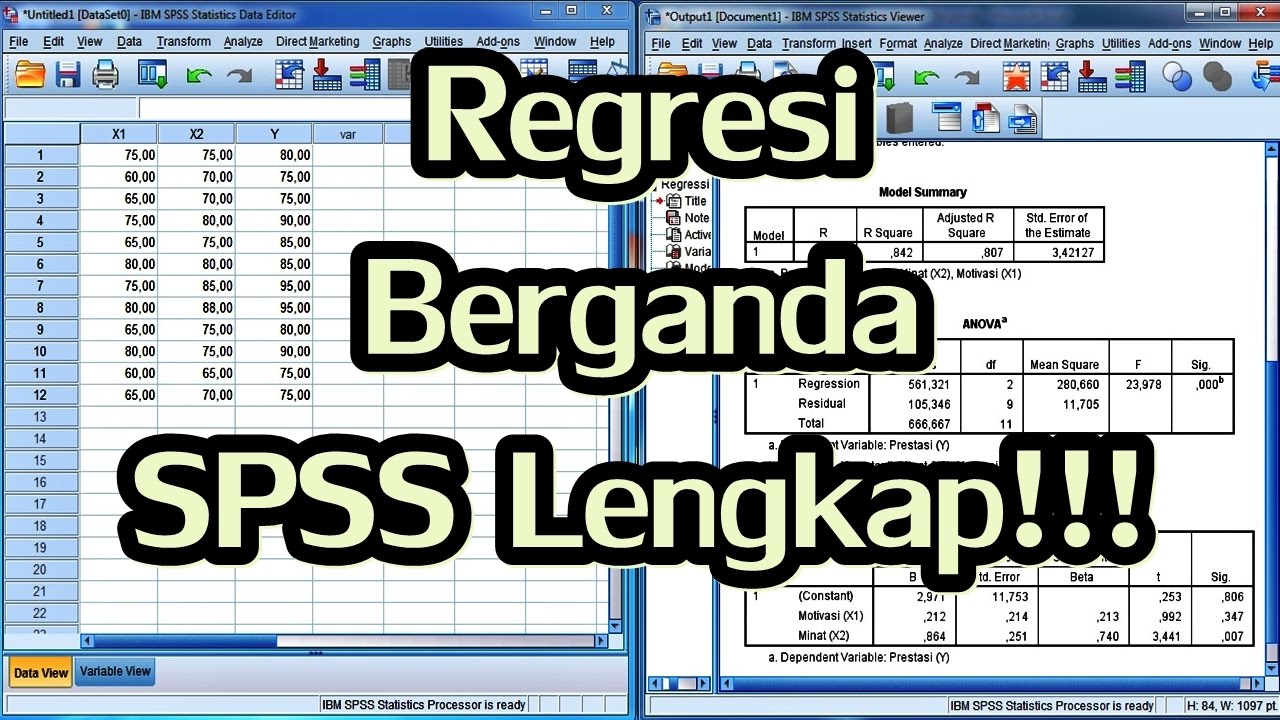
- 😀 In the SPSS example, X1 represents price, X2 represents product quality, and Y represents the purchase decision.
- 😀 The t-test results in the example show no significant effect for X1 (Price), but a significant effect for X2 (Product Quality) on the purchase decision (Y).
- 😀 The F-test in the example reveals that both X1 and X2 together have a significant impact on the dependent variable Y.
- 😀 The R-squared value of 0.327 in the example indicates that 32.7% of the variance in purchase decision is explained by the independent variables X1 (Price) and X2 (Product Quality).
Q & A
What is the main purpose of multiple regression analysis as explained in the video?
-The main purpose of multiple regression analysis is to determine whether independent variables (X) have an effect on the dependent variable (Y). It also helps identify the relationship between multiple variables and how they influence the outcome together.
What does the t-test in multiple regression analysis test for?
-The t-test is used to determine whether there is a significant effect of each independent variable (X) on the dependent variable (Y) individually. It tests the impact of each variable in isolation (partial effect).
What is the function of the F-test in multiple regression analysis?
-The F-test is used to assess the overall significance of the regression model. It checks whether the independent variables collectively have an effect on the dependent variable, testing the hypothesis that all coefficients are equal to zero.
What does the coefficient of determination (R²) indicate in multiple regression?
-The coefficient of determination (R²) indicates the proportion of variance in the dependent variable (Y) that is explained by the independent variables (X). It shows how well the regression model fits the data.
How is the hypothesis testing conducted in multiple regression analysis?
-Hypothesis testing is done by setting up null and alternative hypotheses for each variable. A significance level (alpha) is chosen, and based on the p-values (significance), decisions are made whether to reject or accept the hypothesis.
What is the interpretation when the p-value of a t-test is greater than 0.05?
-If the p-value is greater than 0.05, it indicates that the independent variable does not have a significant effect on the dependent variable. Therefore, the null hypothesis is not rejected.
What does it mean when the t-statistic is less than the critical value (t-table)?
-When the t-statistic is less than the critical value (t-table), it suggests that the effect of the independent variable on the dependent variable is not statistically significant.
How do you interpret the F-statistic in regression analysis?
-The F-statistic compares the model’s fit with and without the independent variables. If the F-statistic is higher than the critical value from the F-distribution table, it suggests that the regression model as a whole significantly affects the dependent variable.
What is the role of R² in understanding the relationship between variables?
-R² helps quantify the strength of the relationship between the independent variables and the dependent variable. For example, an R² value of 0.327 suggests that approximately 32.7% of the variance in the dependent variable is explained by the model.
How do you interpret the significance of X2 when its p-value is 0.001?
-A p-value of 0.001 indicates that X2 has a statistically significant impact on the dependent variable, meaning the null hypothesis for X2 is rejected, and it can be concluded that there is a significant relationship between X2 and Y.
Outlines

This section is available to paid users only. Please upgrade to access this part.
Upgrade NowMindmap

This section is available to paid users only. Please upgrade to access this part.
Upgrade NowKeywords

This section is available to paid users only. Please upgrade to access this part.
Upgrade NowHighlights

This section is available to paid users only. Please upgrade to access this part.
Upgrade NowTranscripts

This section is available to paid users only. Please upgrade to access this part.
Upgrade NowBrowse More Related Video
Cara Uji Regresi Linear Berganda ( Uji t, Uji f dan Uji Determinasi) menggunakan aplikasi SPSS

PERBEDAAN REGRESI LINEAR SEDERHANA DAN REGRESI BERGANDA

Analisis Regresi Linear Berganda
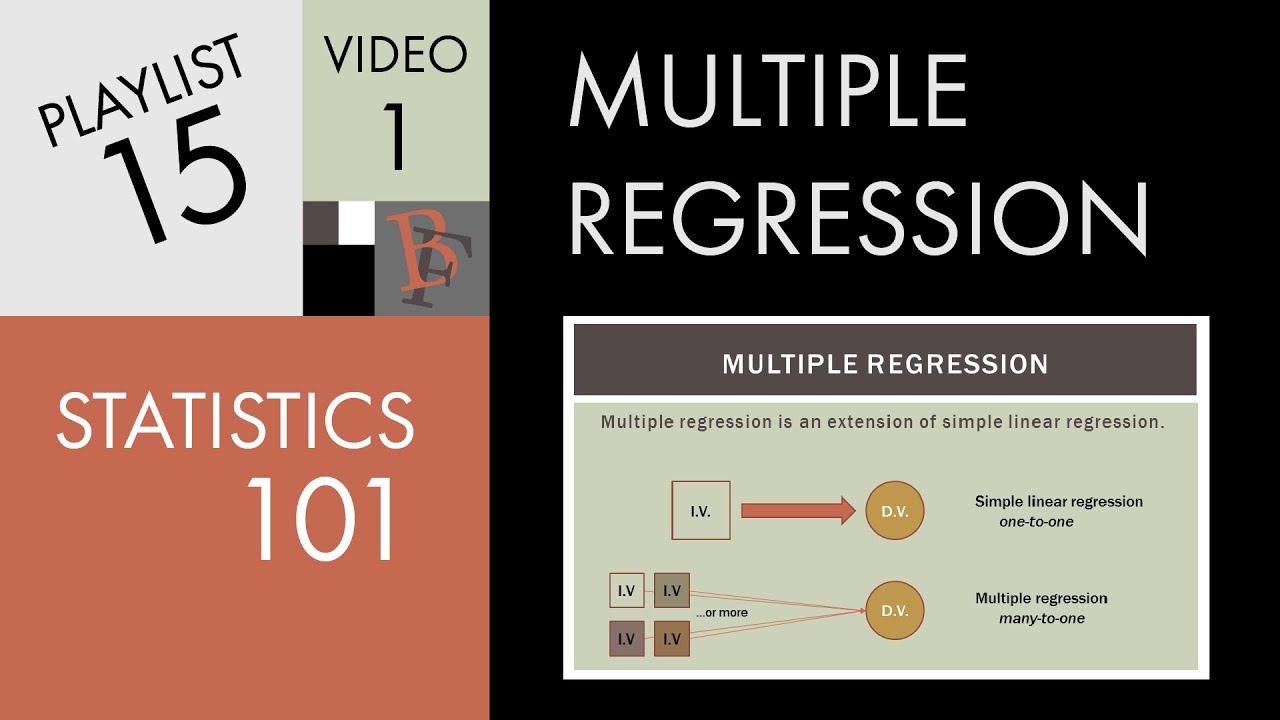
Statistics 101: Multiple Linear Regression, The Very Basics 📈
Uji t dan Uji F dalam Analisis Regresi Berganda dengan SPSS Lengkap

Using Multiple Regression in Excel for Predictive Analysis
5.0 / 5 (0 votes)