Remedial UH matematika
Summary
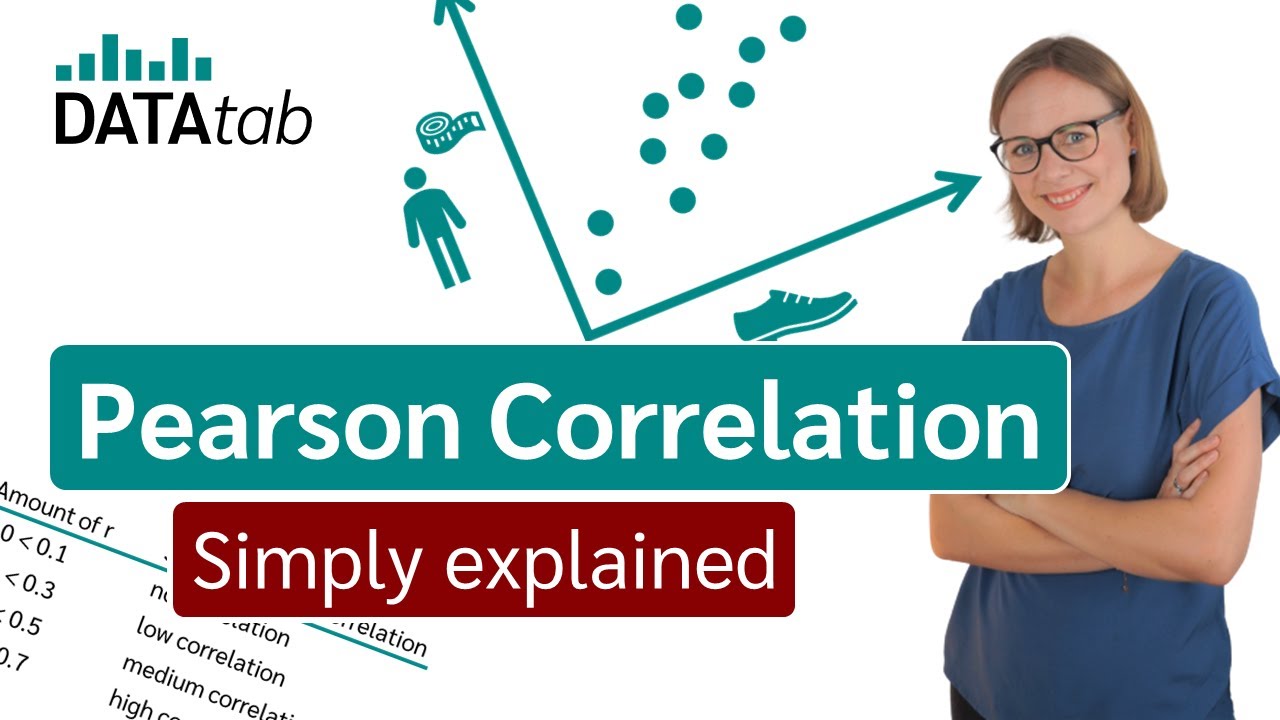
TLDRIn this video, Raihana Syadir Karim from class 11D presents a detailed analysis of two math problems involving the calculation of correlation coefficients using the Pearson method. The first problem explores the relationship between two variables, X and Y, finding a weak positive correlation (r = 0.31). The second problem demonstrates a strong negative correlation (r = -0.97) between the same variables. Raihana walks through the steps of calculating sums, squares, and products of data points, then applies the formula to find the correlation coefficients, concluding with clear interpretations of the results.
Takeaways
- 😀 Introduction of Raihana Syadir Karim from class 11D, presenting a remedial session for a math test from last week.
- 😀 The first task involves calculating the values of X², Y², and XY, followed by summing these values.
- 😀 The calculation for X² involves squaring the given numbers: 100, 25, 36, 225.
- 😀 Y² values are calculated similarly, using numbers like 1, 36, 49, and 100.
- 😀 The XY values are found by multiplying corresponding X and Y values together and then summing them.
- 😀 The total of the summed values provides important statistics like sigma X (36) and sigma Y (24), which are used to calculate further values.
- 😀 The mean values for X (X̄) and Y (Ȳ) are derived by dividing sigma X and sigma Y by the number of data points (n = 4).
- 😀 A correlation coefficient (r) is calculated using a complex formula involving sigma XY, sigma X², and sigma Y².
- 😀 The final r value of 0.31 indicates a weak positive correlation between X and Y.
- 😀 The second part of the transcript focuses on another data set, where similar calculations are performed, yielding an r value of -0.97, indicating a strong negative correlation between X and Y.
Q & A
What is the main objective of the speaker in this video?
-The main objective of the speaker is to explain the process of calculating the Pearson correlation coefficient (r) for two sets of data, as part of a remedial mathematics exam.
What does the speaker mean by 'X2', 'Y2', and 'XY'?
-'X2' refers to the square of the X values, 'Y2' refers to the square of the Y values, and 'XY' refers to the product of the X and Y values for each pair of data points.
How did the speaker calculate the value of 'X̄' (mean of X)?
-The speaker calculated the mean of X (denoted as 'X̄') by dividing the sum of the X values (ΣX = 36) by the total number of data points (n = 4). Thus, X̄ = 36 / 4 = 9.
How was the mean of Y (denoted as 'Ȳ') calculated?
-The mean of Y (Ȳ) was calculated by dividing the sum of the Y values (ΣY = 24) by the number of data points (n = 4). Hence, Ȳ = 24 / 4 = 6.
What formula did the speaker use to calculate the Pearson correlation coefficient (r)?
-The formula used to calculate the Pearson correlation coefficient (r) is: r = (ΣXY - n * X̄ * Ȳ) / √[(ΣX² - n * X̄²) * (ΣY² - n * Ȳ²)].
What does the calculated Pearson correlation coefficient of 0.31 indicate?
-A Pearson correlation coefficient of 0.31 indicates a weak positive correlation between the two variables (X and Y).
What does a Pearson correlation coefficient of -0.99 suggest about the relationship between X and Y?
-A Pearson correlation coefficient of -0.99 suggests a very strong negative correlation between the variables X and Y, meaning as one variable increases, the other tends to decrease.
What is the significance of the term 'sigma' (Σ) in the calculations?
-'Sigma' (Σ) represents the summation of values. In this case, it is used to sum the X values (ΣX), the Y values (ΣY), the squared X values (ΣX²), the squared Y values (ΣY²), and the product of X and Y (ΣXY).
How did the speaker handle the square roots in the formula for calculating r?
-The speaker took the square roots of the terms in the denominator of the Pearson correlation coefficient formula. For example, ΣX² - n * X̄² and ΣY² - n * Ȳ² were square-rooted to calculate the final result.
What does the result of -0.99 for the second set of data indicate in terms of correlation strength?
-The result of -0.99 indicates a very strong negative correlation between the variables X and Y in the second dataset. This means that as X increases, Y decreases significantly.
Outlines

This section is available to paid users only. Please upgrade to access this part.
Upgrade NowMindmap

This section is available to paid users only. Please upgrade to access this part.
Upgrade NowKeywords

This section is available to paid users only. Please upgrade to access this part.
Upgrade NowHighlights

This section is available to paid users only. Please upgrade to access this part.
Upgrade NowTranscripts

This section is available to paid users only. Please upgrade to access this part.
Upgrade NowBrowse More Related Video


5.0 / 5 (0 votes)