Using Multiple Regression in Excel for Predictive Analysis
Summary
TLDRThis script offers a tutorial on using Excel for predictive analysis in a factory setting. It covers setting up a linear regression model with three independent variables—products A, B, and C—and one dependent variable, the factory cost. The process includes loading the Analysis ToolPak, performing regression analysis, interpreting P-values to determine variable significance, and adjusting the model by excluding non-significant variables. The end goal is to predict factory costs based on product quantities, demonstrating practical application of multiple linear regression.
Takeaways
- 📊 The video discusses using Excel for predictive analysis with a focus on setting up a predictive model for a factory that produces three types of products.
- 🔢 The cost of running the factory is the dependent variable, which is influenced by the quantities of products A, B, and C produced, serving as the independent variables.
- 📈 Linear regression is chosen for the predictive analysis due to the assumed linear relationship between the cost and the quantities of products produced.
- 🛠️ Before starting, the script emphasizes the need to ensure the regression tool is loaded in Excel, which can be done through the 'Analysis ToolPak'.
- 📝 The script provides a step-by-step guide on how to perform multiple linear regression in Excel, starting with selecting the Y range for the dependent variable and the X range for the independent variables.
- 📋 The inclusion of column labels in the regression analysis is mentioned, which is important for clarity and reference in the output.
- 📉 The script highlights the importance of inspecting P-values to determine the significance of each independent variable in the predictive model.
- 🚫 It is noted that any independent variable with a P-value of 0.15 or greater should be excluded from the model as it does not significantly contribute to predicting outcomes.
- ♻️ After evaluating the P-values, the script demonstrates how to rerun the regression analysis excluding the independent variable with a low predictive value.
- 🔑 The final step involves using the coefficients from the regression analysis to plug into a formula to make predictions about the factory cost based on given quantities of products.
- 💡 The video concludes with an example prediction, demonstrating how to apply the regression formula to estimate the cost of running the factory for specific product quantities.
Q & A
What is the purpose of using Excel for predictive analysis in the given scenario?
-The purpose is to set up a predictive model for a factory that produces three types of products (A, B, and C) to analyze how the quantity of each product affects the cost of running the factory.
What is the dependent variable in the predictive model discussed in the script?
-The dependent variable is the cost of running the factory, which is what the model aims to predict based on the quantities of products produced.
What are the independent variables in the predictive model?
-The independent variables are the quantities of the three products (A, B, and C) produced in the factory.
What statistical method is being used for the predictive analysis in the script?
-The method being used is multiple linear regression, which allows for the prediction of a dependent variable based on multiple independent variables.
How many months of data has been collected for the predictive analysis?
-The data collected spans over the course of 19 months.
What is the significance of the P-value in the context of this predictive analysis?
-The P-value is used to determine the significance of each independent variable in predicting the outcome. Variables with P-values of 0.15 or greater are considered not significant and are excluded from the model.
Why was the independent variable for product A excluded from the model?
-Product A was excluded because its P-value was 0.23, which is greater than the threshold of 0.15, indicating it is not significant in predicting the cost of running the factory.
What is the intercept in the context of the regression equation?
-The intercept is the constant term in the regression equation, representing the expected value of the dependent variable when all independent variables are zero.
How does Excel assist in performing the multiple linear regression?
-Excel provides a 'Data Analysis' tool with a 'Regression' function that automates the process of running a regression analysis and provides the coefficients and intercept for the model.
What is the final step in using the regression model to make a prediction?
-The final step is to plug the coefficients and intercept from the regression output into the regression equation, along with the values of the independent variables, to calculate the predicted cost of running the factory.
How does the script illustrate the application of the regression model to predict factory costs?
-The script provides an example where the model is used to predict the monthly cost for producing specific quantities of products B and C, excluding product A due to its low predictive value.
Outlines

This section is available to paid users only. Please upgrade to access this part.
Upgrade NowMindmap

This section is available to paid users only. Please upgrade to access this part.
Upgrade NowKeywords

This section is available to paid users only. Please upgrade to access this part.
Upgrade NowHighlights

This section is available to paid users only. Please upgrade to access this part.
Upgrade NowTranscripts

This section is available to paid users only. Please upgrade to access this part.
Upgrade NowBrowse More Related Video

Вправа 17. Математичні та статистичні функції | 9 клас | Бондаренко

Excel: Getting Started
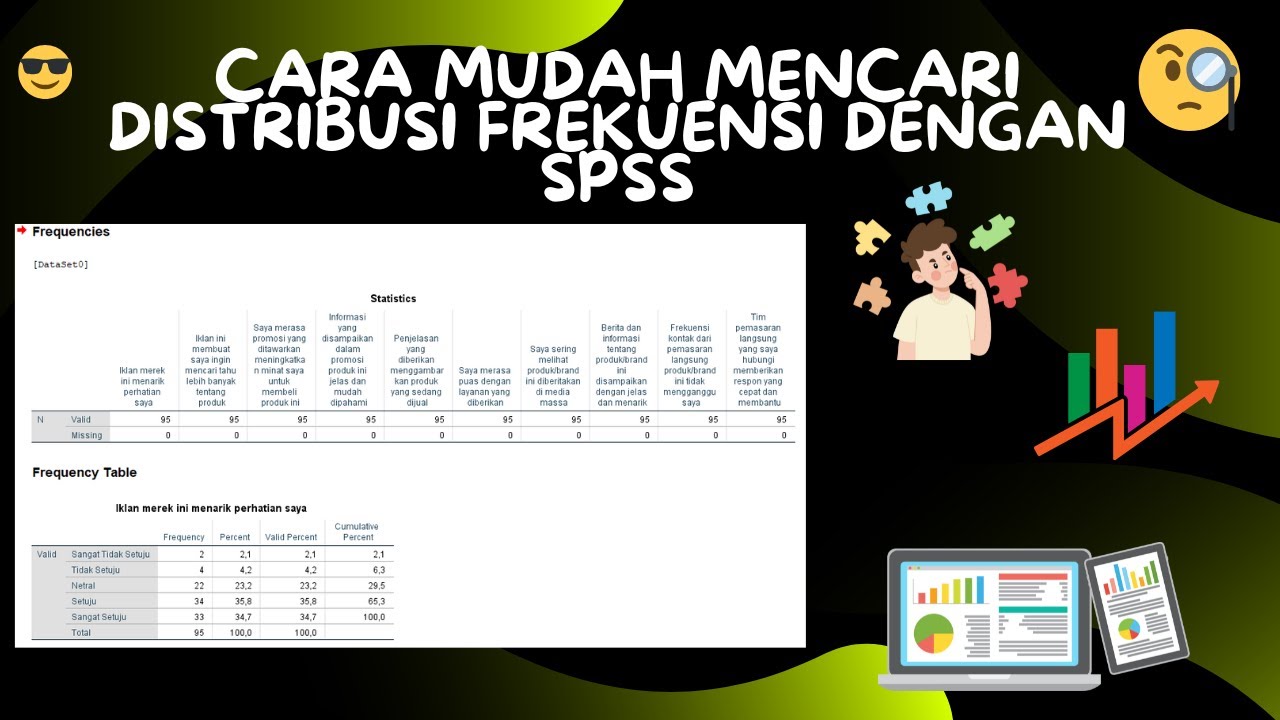
Cara Mudah Mencari Distribusi Frekuensi Dengan SPSS
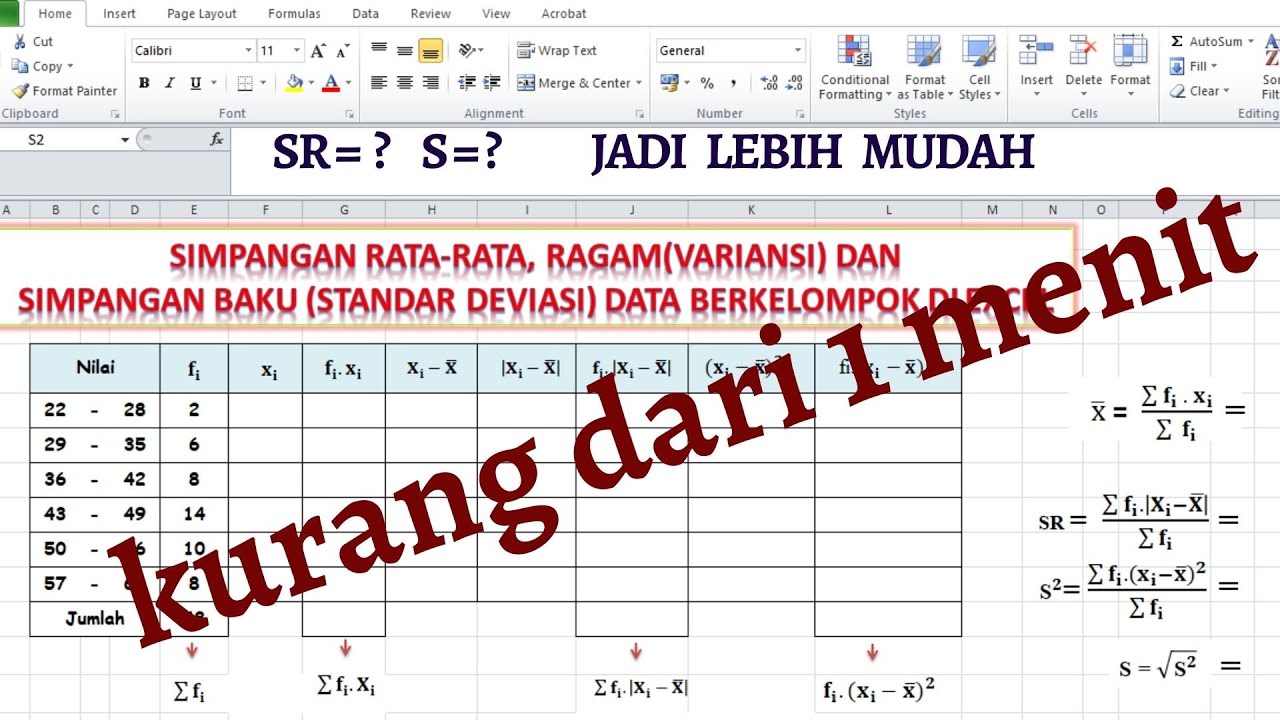
MENGHITUNG SIMPANGAN RATA-RATA, RAGAM DAN SIMPANGAN BAKU DATA KELOMPOK DI EXCEL

Metode Elemen Hingga #1 Analisa Rangka Batang Sederhana dengan SAP2000
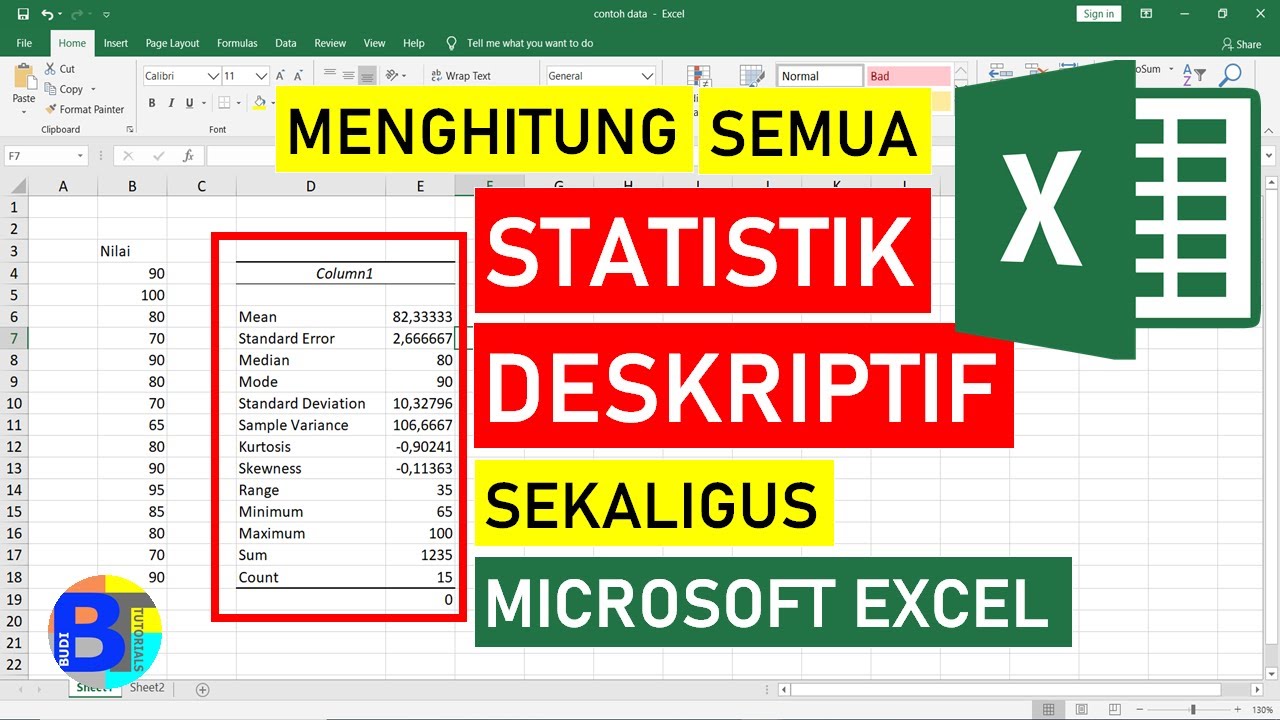
Cara Menghitung Statistik Deskriptif dengan Excel || Statistik Excel
5.0 / 5 (0 votes)