Latihan SPSS Uji ANOVA Statistika Farmasi
Summary
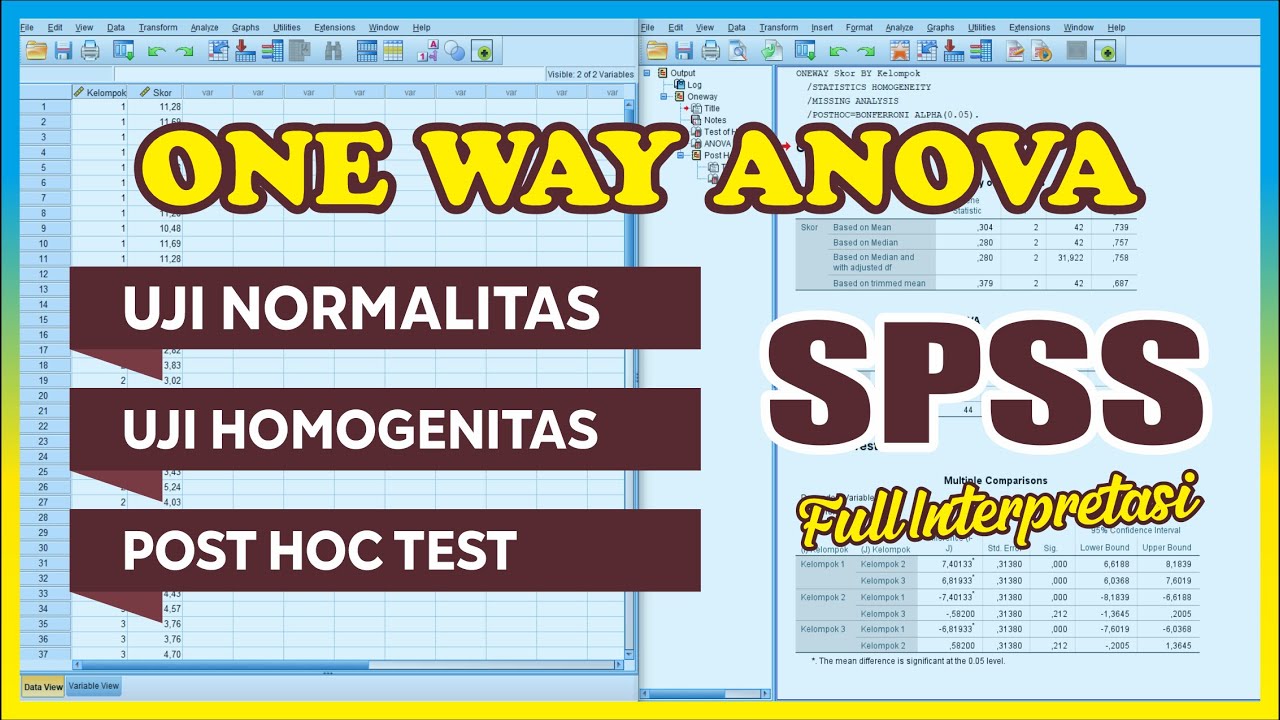
TLDRThis video tutorial explains how to perform a One-Way ANOVA test using SPSS, specifically for analyzing the effectiveness of four drug formulations on parasitic larvae. The script walks through the process of setting up the data in SPSS, conducting the analysis, and interpreting the results, including descriptive statistics, homogeneity of variances, ANOVA, and post-hoc tests. The tutorial also provides guidance on how to interpret significance values and determine which drug formulation performs best based on larvae count reduction. It concludes with a review of the SPSS output, explaining how to assess group differences and draw clinical conclusions.
Takeaways
- 😀 Oneway Anova is used when the independent variable is categorical and the dependent variable is numerical (interval or ratio data).
- 😀 The example provided uses data from a clinical study on the effect of benzimidazole treatments on worms with four formulations (A, B, C, and D).
- 😀 The dependent variable in the study is the number of worm larvae, while the independent variable is the type of drug formulation.
- 😀 The SPSS analysis process involves selecting 'Analyze', 'Compare Means', and 'Oneway Anova' to conduct the analysis.
- 😀 The independent variable (drug type) is placed under 'Factor' and the dependent variable (worm larvae count) is placed under 'Dependent'.
- 😀 Descriptive statistics and tests for homogeneity of variances are important steps to check the data's suitability for ANOVA.
- 😀 If the significance value for homogeneity of variances is greater than 0.05, the variances are considered homogeneous and the ANOVA test can proceed.
- 😀 ANOVA tests the null hypothesis (H0), which assumes no significant difference in the mean number of larvae between the different drug groups.
- 😀 If the significance value from the ANOVA is less than 0.05, the null hypothesis is rejected, indicating that at least two groups differ significantly.
- 😀 Post-hoc tests are conducted to identify which specific drug formulations have significant differences in their effects on worm larvae count.
- 😀 The post-hoc analysis revealed that all drug comparisons were significantly different except for the comparison between drugs B and D, which showed no significant difference.
Q & A
What is the purpose of conducting a one-way ANOVA in this experiment?
-The purpose of conducting a one-way ANOVA is to determine whether there is a statistically significant difference in the number of larvae in the different treatment groups (based on different formulations of the deworming drug).
What is the role of the independent and dependent variables in this analysis?
-In this analysis, the independent variable is the type of drug formulation (labeled A, B, C, D), and the dependent variable is the number of larvae (the outcome measured after treatment).
What does the homogeneity of variances test indicate in this analysis?
-The homogeneity of variances test checks if the variances across the groups are equal. If the p-value is greater than 0.05, it indicates that the variances are homogeneous, allowing the ANOVA test to proceed.
How do you interpret the results of the ANOVA test?
-If the p-value of the ANOVA test is less than 0.05, the null hypothesis is rejected, meaning there is a statistically significant difference in the number of larvae between at least two groups. If the p-value is greater than 0.05, it indicates no significant difference.
What is the significance of post-hoc testing in this analysis?
-Post-hoc testing helps to identify which specific groups have significant differences in their mean values. It compares each pair of groups to determine where the differences lie.
What can you conclude if the p-value for a comparison is greater than 0.05 in the post-hoc test?
-If the p-value is greater than 0.05 in a post-hoc test, it means that there is no significant difference between those two groups, implying that the performance of the drugs in those groups is similar.
How are the drug formulations compared in this experiment?
-The drug formulations are compared by analyzing the number of larvae in each treatment group after 8 days. Formulations A, B, C, and D are compared using one-way ANOVA, and post-hoc testing identifies significant differences.
What is the importance of determining the group with the lowest larvae count?
-The group with the lowest larvae count is important because it represents the most effective drug formulation in killing the larvae, indicating the best drug treatment.
How do you know which drug formulation is the most effective based on the analysis?
-The most effective drug formulation is the one that results in the lowest number of larvae. This is determined through post-hoc tests, where significant differences in larvae count between treatments are evaluated.
What would it mean if the p-value between two drug formulations is less than 0.05?
-If the p-value between two drug formulations is less than 0.05, it means that the difference in larvae count between those two formulations is statistically significant, suggesting that one formulation is more effective than the other.
Outlines

This section is available to paid users only. Please upgrade to access this part.
Upgrade NowMindmap

This section is available to paid users only. Please upgrade to access this part.
Upgrade NowKeywords

This section is available to paid users only. Please upgrade to access this part.
Upgrade NowHighlights

This section is available to paid users only. Please upgrade to access this part.
Upgrade NowTranscripts

This section is available to paid users only. Please upgrade to access this part.
Upgrade NowBrowse More Related Video
Very Complete !! SPSS Anova Test – One-Way Anova with Post Hoc Test Anova SPSS
One Way Analysis of Variance

Cara Uji Normalitas dan Homogenitas Menggunakan SPSS dengan Mudah

What Is Anova? | Introduction To Analysis And Variance | Anova Explained | Simplilearn

Cara Mudah Uji Homogenitas Menggunakan SPSS

TUTORIAL SPSS : Multiple Correlation Test SPSS
5.0 / 5 (0 votes)