11 Most Important Tools in Excel | Malayalam Tutorial
Summary
TLDRThis video provides an in-depth guide to using Excel tables for effective data management and analysis. It covers creating tables, applying predefined styles, using calculated columns, and enabling total rows for aggregation. The Quick Analysis tool is introduced for fast formatting, charting, and totals. Additionally, the video demonstrates how to use pivot tables, sparklines, and conditional formatting to enhance data presentation. It also explains how to assign custom table names, utilize table design options, and perform efficient data manipulation within Excel, making it a valuable resource for users looking to improve their Excel skills.
Takeaways
- 😀 Excel Tables are a powerful tool for managing data, helping with organization and analysis.
- 😀 You can easily convert data into an Excel Table by selecting data and using the 'Insert' tab to create a table.
- 😀 Once data is formatted as a table, Excel automatically applies color formatting, making it easier to read.
- 😀 The 'Table Design' tab appears when a table is selected, allowing for customization like renaming the table.
- 😀 You can quickly reference a named table across multiple sheets within the same workbook for easy data selection.
- 😀 Excel offers pre-defined table styles that can be applied for better formatting and visual clarity.
- 😀 Calculated columns in Excel Tables automatically propagate formulas across rows, saving time and effort.
- 😀 The 'Total Row' feature in Excel tables helps quickly summarize data with functions like SUM, AVERAGE, COUNT, etc.
- 😀 Excel Tables expand automatically when new data is added, ensuring consistency in table formatting and formulas.
- 😀 The 'Quick Analysis' tool provides instant access to various analysis options like conditional formatting, charts, and totals.
- 😀 Pivot Tables and Sparkline charts can be easily created from Excel Tables for advanced data analysis and visualization.
Q & A
What is the purpose of converting data into an Excel table?
-Converting data into an Excel table helps in easily managing and analyzing data. It provides automatic formatting, structured data handling, and enables quick filtering, sorting, and calculations.
How does Excel Table make data analysis easier?
-Excel tables allow for automatic updates of formulas, easy handling of large datasets, and enable features like calculated columns and aggregation functions (sum, average, count) without the need for manual adjustments.
What does the 'Table Design' tab offer in Excel?
-The 'Table Design' tab in Excel offers features like renaming tables for easier reference, selecting predefined table styles, and adding table-specific features such as total rows and calculated columns.
What is the benefit of defining a name for an Excel table?
-Defining a name for an Excel table allows easy referencing and selection of the table across multiple worksheets. It also simplifies working with formulas and external references.
How does the Quick Analysis Tool assist in data analysis?
-The Quick Analysis Tool offers a fast way to apply formatting, charts, totals, tables, and sparkline charts, all without navigating away from the selected data, making it easier to analyze and visualize data.
What happens when you add new data adjacent to an existing Excel table?
-When new data is added adjacent to an Excel table, the table automatically expands to include the new rows or columns, ensuring that formatting and formulas are applied to the new data.
What are 'calculated columns' in Excel tables, and how do they work?
-Calculated columns in Excel tables are columns where a formula is applied. When a formula is entered in one cell, it is automatically copied to the other cells in the column, making it easy to calculate values across the dataset.
What is the significance of the 'Total Row' feature in Excel tables?
-The 'Total Row' feature in Excel tables adds a row at the bottom of the table where you can quickly calculate and display aggregate values such as sum, average, count, or other statistics for the data in the table.
How do Pivot Tables contribute to data analysis in Excel?
-Pivot Tables allow you to summarize and analyze data dynamically, enabling you to extract meaningful insights from large datasets by reorganizing, filtering, and aggregating data in various ways.
What is the function of Sparkline charts in Excel?
-Sparkline charts are mini charts that are embedded within a single cell, providing a compact visual representation of trends or patterns in the data, such as line, column, or win/loss charts.
Outlines

This section is available to paid users only. Please upgrade to access this part.
Upgrade NowMindmap

This section is available to paid users only. Please upgrade to access this part.
Upgrade NowKeywords

This section is available to paid users only. Please upgrade to access this part.
Upgrade NowHighlights

This section is available to paid users only. Please upgrade to access this part.
Upgrade NowTranscripts

This section is available to paid users only. Please upgrade to access this part.
Upgrade Now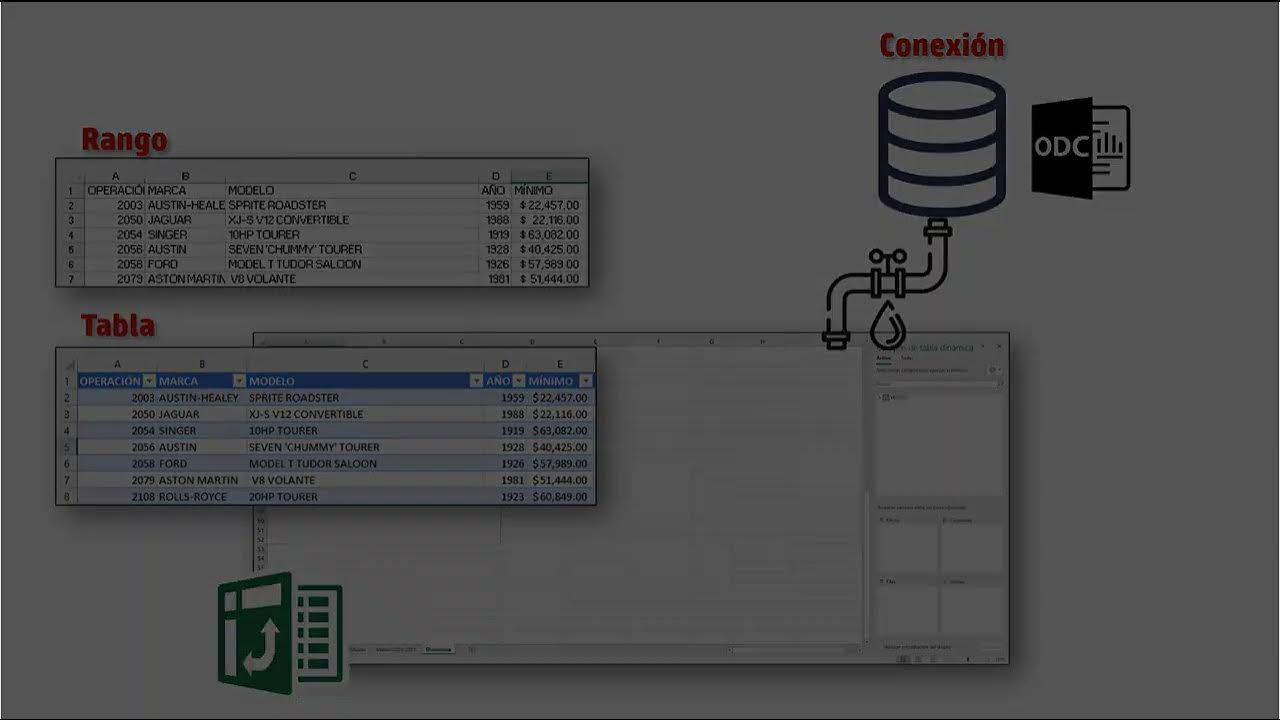


5.0 / 5 (0 votes)