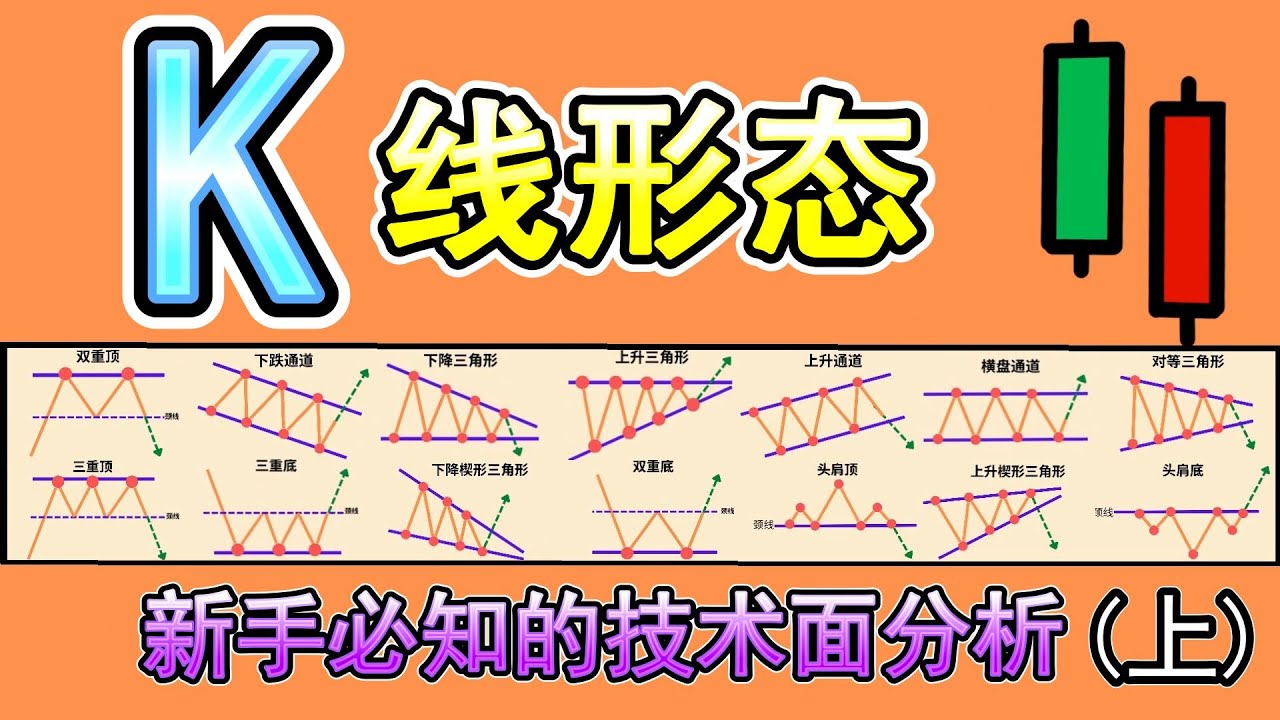
Padrões de Reversão
Summary
TLDRThis lesson covers key reversal chart patterns in technical analysis, including Head and Shoulders, Inverse Head and Shoulders, Wedge, and Derivative patterns. The instructor emphasizes the importance of understanding volume and liquidity in trading these patterns, explaining how decreasing volume signals weakening trends and potential reversals. Traders are advised to wait for breakouts or pullbacks for safer entries. The lesson also touches on how these patterns relate to Smart Money Concepts (SMC) and ICT theories. By combining these techniques, traders can enhance their analysis and improve their trading strategies.
Takeaways
- 😀 Reversal patterns in technical analysis suggest a potential change in the price trend of an asset, contrasting with continuation patterns which indicate a pause.
- 😀 Double top and double bottom patterns, while popular, are not recommended due to the potential for liquidity traps and institutional manipulation at these levels.
- 😀 The wedge pattern, particularly the reversal wedge, can signal trend shifts, with the high and low trendlines converging and indicating a potential reversal.
- 😀 The inverse head and shoulders pattern (shoulder-head-shoulder) is the opposite of the regular pattern and signals a reversal from bearish to bullish.
- 😀 The wedge pattern can be analyzed through various methods, including Fibonacci projections and volume analysis, for more precise entries and exits.
- 😀 Volume plays a critical role in confirming price actions in reversal patterns, helping traders determine whether the trend is losing momentum or gaining strength.
- 😀 The Deviation pattern, similar to the wedge, typically indicates a strong reversal after price pushes in a direction but fails to maintain momentum, often leading to a sharp move in the opposite direction.
- 😀 Deriva, a pattern of loss of momentum after a strong move, signals a potential reversal, and volume analysis helps in predicting the strength of such a reversal.
- 😀 The Head and Shoulders pattern can be identified after a significant trend move, where a peak (head) is formed between two lower peaks (shoulders), and its break signals a reversal.
- 😀 Reversal patterns work best when combined with other advanced trading theories like Smart Money Concepts (SMC), ICT, WOF, and Elliott Waves for better market predictions and more reliable trades.
Q & A
What is the main focus of this lesson on graphic analysis?
-The main focus of this lesson is on reversal chart patterns, which indicate a potential change in the price direction of a financial asset, contrasting with continuation patterns that suggest a temporary pause in the trend.
Why are Double Top and Double Bottom patterns not recommended for trading?
-Double Top and Double Bottom patterns are not recommended because they often have low liquidity, as institutional players use these areas to capture liquidity, leading to price manipulation and unreliable reversals.
How is the Head and Shoulders pattern used to identify market reversals?
-The Head and Shoulders pattern is identified by three peaks, with the middle peak being the highest. A reversal from an uptrend to a downtrend is suggested when the 'neckline' is broken, indicating a potential price decline.
What is the difference between a Rising Wedge and a Falling Wedge?
-A Rising Wedge is a reversal pattern that suggests a trend reversal from a downtrend to an uptrend, while a Falling Wedge indicates a potential reversal from an uptrend to a downtrend.
What role does volume analysis play in identifying reversal patterns?
-Volume analysis is crucial for confirming the validity of reversal patterns. A decrease in volume can signal weakening momentum, which often precedes a price reversal, helping traders predict the market's next move.
What is the significance of liquidity in patterns like Double Top and Double Bottom?
-Liquidity zones in patterns like Double Top and Double Bottom attract institutional players who capture liquidity, which can lead to market manipulation and false signals, making these patterns less reliable.
How does the Wedge pattern assist in projecting price targets?
-The Wedge pattern helps project price targets by measuring the distance from the point of breakout or the closure of the wedge. Additionally, Fibonacci projections can be used to estimate possible price levels after the pattern breaks.
What is the Drift pattern, and why is it difficult to trade?
-The Drift pattern is characterized by price trying to continue in a direction despite losing momentum, often leading to a sharp reversal. It's challenging to trade because it is volatile, and traders must carefully watch for signs of weakening momentum.
What makes the Head and Shoulders pattern so effective in market reversals?
-The Head and Shoulders pattern is effective because it is associated with Smart Money Concepts (SMC) and market structure. The pattern provides clear entry points when the price breaks the neckline, signaling a strong reversal.
How are Fibonacci retracement levels used in conjunction with reversal patterns?
-Fibonacci retracement levels are used to determine additional targets after a reversal pattern completes. By measuring the distance of the pattern and applying Fibonacci ratios (such as 61.8% or 100%), traders can estimate potential price levels where the trend might continue or reverse.
Outlines

This section is available to paid users only. Please upgrade to access this part.
Upgrade NowMindmap

This section is available to paid users only. Please upgrade to access this part.
Upgrade NowKeywords

This section is available to paid users only. Please upgrade to access this part.
Upgrade NowHighlights

This section is available to paid users only. Please upgrade to access this part.
Upgrade NowTranscripts

This section is available to paid users only. Please upgrade to access this part.
Upgrade NowBrowse More Related Video
【K线形态 技术面分析】(上)你必知的18种K线形态完整教学|K线形态交易策略大公开|技术分析新手入门教学|专业交易员必备的K线形态技术分析|Chart Pattern Analysis

ICT Mentorship Core Content - Month 03 - Market Maker Trap Head Shoulders Pattern

REALISTIC Chainlink LINK Price Prediction For 2024.... BIG Things Coming

Best Bank Nifty Scalping Strategy || Golden 10% Q&A

Do You Like Money?

The BEST Guide to CHART PATTERNS Price Action
5.0 / 5 (0 votes)