Statistik#1 : Diagram | Kelas X Fase E Kurikulum Merdeka
Summary
TLDRThis educational video introduces basic statistical concepts and methods, focusing on different types of diagrams used to represent data. It covers pie charts, bar graphs, histograms, and frequency polygons, explaining how to calculate percentages, angles for pie charts, and data interpretation for bar and histogram charts. The video also includes practical examples, such as interpreting educational data and COVID-19 statistics, with clear instructions on how to create these diagrams. Designed for 10th-grade students in Indonesia's Merdeka Curriculum, this content aims to enhance students' understanding of data representation techniques.
Takeaways
- 😀 Circle diagrams (Diagram Lingkaran) represent data using angles and percentages, where each category's angle is calculated by dividing its value by the total and multiplying by 360°.
- 😀 To create a circle diagram, first calculate the percentage of each category by dividing its value by the total, then multiply by 360° to find the corresponding angle.
- 😀 Example: If 15 out of 50 children like reading, it represents 30% and the corresponding angle for the circle diagram is 108°.
- 😀 Bar diagrams (Diagram Batang) can be vertical or horizontal, representing categories with bars proportional to the data values.
- 😀 In bar diagrams, categories like educational levels (e.g., SD, SMP, SMA) can be represented by the length of the bars.
- 😀 Histogram and frequency polygon are used to represent grouped continuous data. The histogram displays the frequency as bars, while the frequency polygon is formed by connecting midpoints of these bars.
- 😀 For histograms, class intervals (e.g., 30-40) are used to group data, and the frequency is represented by the height of the bars.
- 😀 Frequency polygons are made by connecting the midpoints of the bars in a histogram to create a continuous line, making the data distribution clearer.
- 😀 When constructing a frequency polygon, use the midpoint of each class interval, e.g., the midpoint of 30-40 is 35.
- 😀 In a histogram, ensure the spacing between bars is consistent to maintain clarity and accuracy in representing the data.
- 😀 For visualizing COVID-19 data (like confirmed, recovered, or active cases), diagrams can be used to represent different categories, showing trends and comparisons in a simple way.
Q & A
What is the main purpose of this video?
-The main purpose of this video is to explain statistical concepts such as data representation using various types of diagrams like circle diagrams, bar charts, histograms, and frequency polygons, specifically for Class 10 students in the context of the 'Merdeka Curriculum'.
How is a circle diagram (pie chart) constructed based on the data provided?
-To construct a circle diagram, the percentage of each category is first calculated by dividing the frequency of that category by the total number of items and multiplying by 100. The angle for each segment is calculated by dividing the frequency by the total and multiplying by 360 degrees.
What is the formula for calculating the percentage in a circle diagram?
-The formula for calculating the percentage is: (Frequency of category / Total number of items) * 100%.
How do you determine the angle of each segment in a circle diagram?
-The angle of each segment in a circle diagram is determined by using the formula: (Frequency of category / Total number of items) * 360 degrees.
What are the key steps involved in creating a bar chart?
-To create a bar chart, first, the categories (like education levels in the example) are plotted on one axis, and the corresponding frequencies are plotted on the other axis. Bars are then drawn to represent the frequency of each category, either vertically or horizontally.
What is a histogram, and how is it different from a bar chart?
-A histogram is a type of bar chart used to represent frequency distribution of grouped continuous data. Unlike a bar chart, the bars in a histogram touch each other, representing intervals of data, whereas bars in a standard bar chart are separate, representing discrete categories.
How is the midpoint of a grouped data interval calculated in a frequency polygon?
-The midpoint of a grouped data interval is calculated by averaging the lower and upper boundaries of the interval. For example, for the interval 30-40, the midpoint would be (30 + 40) / 2 = 35.
What is the significance of the frequency polygon in data representation?
-A frequency polygon is used to represent the data by connecting the midpoints of the top of each bar in a histogram. It helps to observe the overall trend and distribution of data more smoothly compared to individual bars in a histogram.
How should the intervals be handled when creating a frequency table with grouped data?
-When creating a frequency table with grouped data, the intervals must be consistent, and the lower boundary of each interval is typically adjusted by subtracting 0.5 from the starting value to account for discrete data points.
What kind of data can be visualized using the diagrams discussed in the video?
-The diagrams discussed in the video, including circle diagrams, bar charts, histograms, and frequency polygons, can be used to visualize a variety of data types such as categorical data, frequency distributions, and grouped data, as demonstrated with examples like student hobbies and COVID-19 cases.
Outlines

This section is available to paid users only. Please upgrade to access this part.
Upgrade NowMindmap

This section is available to paid users only. Please upgrade to access this part.
Upgrade NowKeywords

This section is available to paid users only. Please upgrade to access this part.
Upgrade NowHighlights

This section is available to paid users only. Please upgrade to access this part.
Upgrade NowTranscripts

This section is available to paid users only. Please upgrade to access this part.
Upgrade NowBrowse More Related Video
Data dan Diagram - Matematika Kelas 7

1 PENYAJIAN DATA - STATISTIKA - KELAS 7 SMP
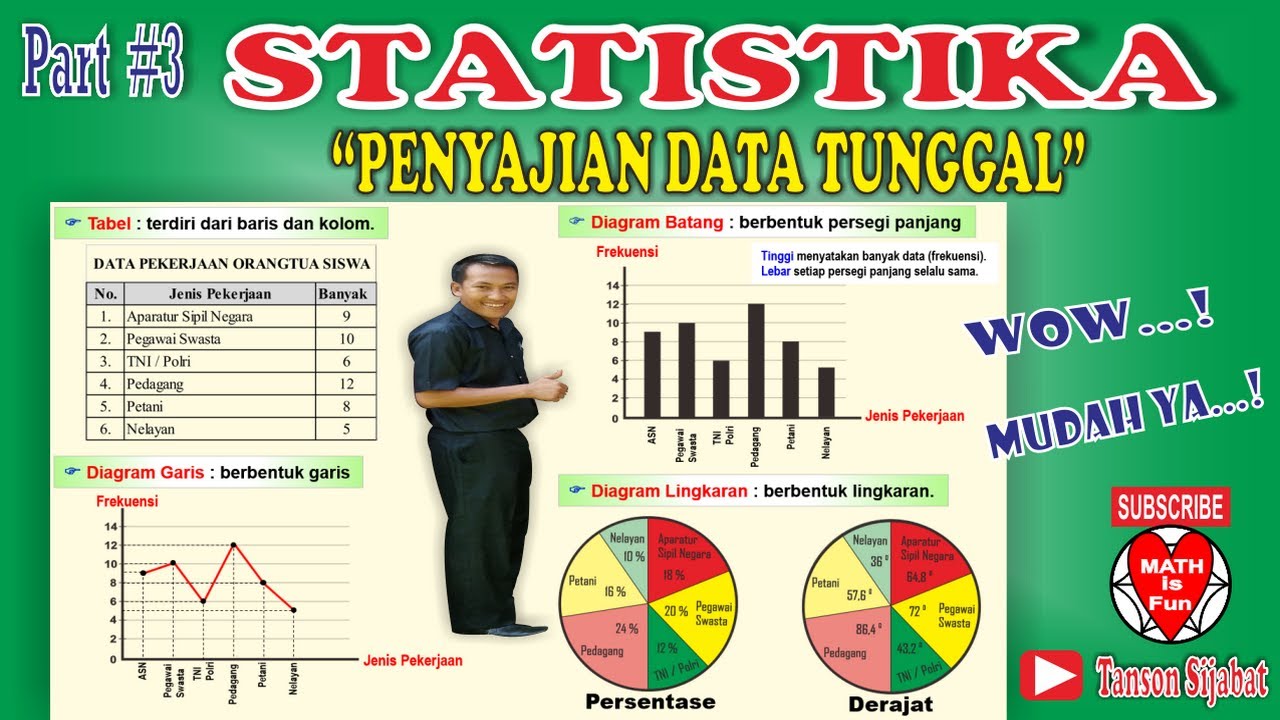
STATISTIKA | PENYAJIAN DATA TUNGGAL [Tabel, Diagram Garis, Diagram Batang, Lingkaran]

Representações Gráficas I | Estatística Básica 03
KONSEP DASAR STATISTIKA DAN DISTRIBUSI FREKUENSI
PENYAJIAN DATA || TABEL DIAGRAM GRAFIK (PART 1)
5.0 / 5 (0 votes)