Bayesian Estimation in Machine Learning - Introduction and Examples
Summary
TLDRIn this introduction to machine learning for Earth observation, Yan Yan Juan, a guest professor at the Technical University of Munich, discusses key applications of machine learning in Earth observation tasks. He covers examples of classification, segmentation, and regression problems, demonstrating how machine learning can be used to estimate urban structures, segment building footprints, and predict continuous variables like tree height. The talk highlights the importance of optimal estimators in Earth observation models, focusing on the challenge of obtaining the best estimates from noisy input data, and presents a simple deterministic linear model as an example.
Takeaways
- 😀 Yan Yan Juan introduces the topic of Bayesian estimation in machine learning for Earth observation, aiming for both beginners and those with mathematical background.
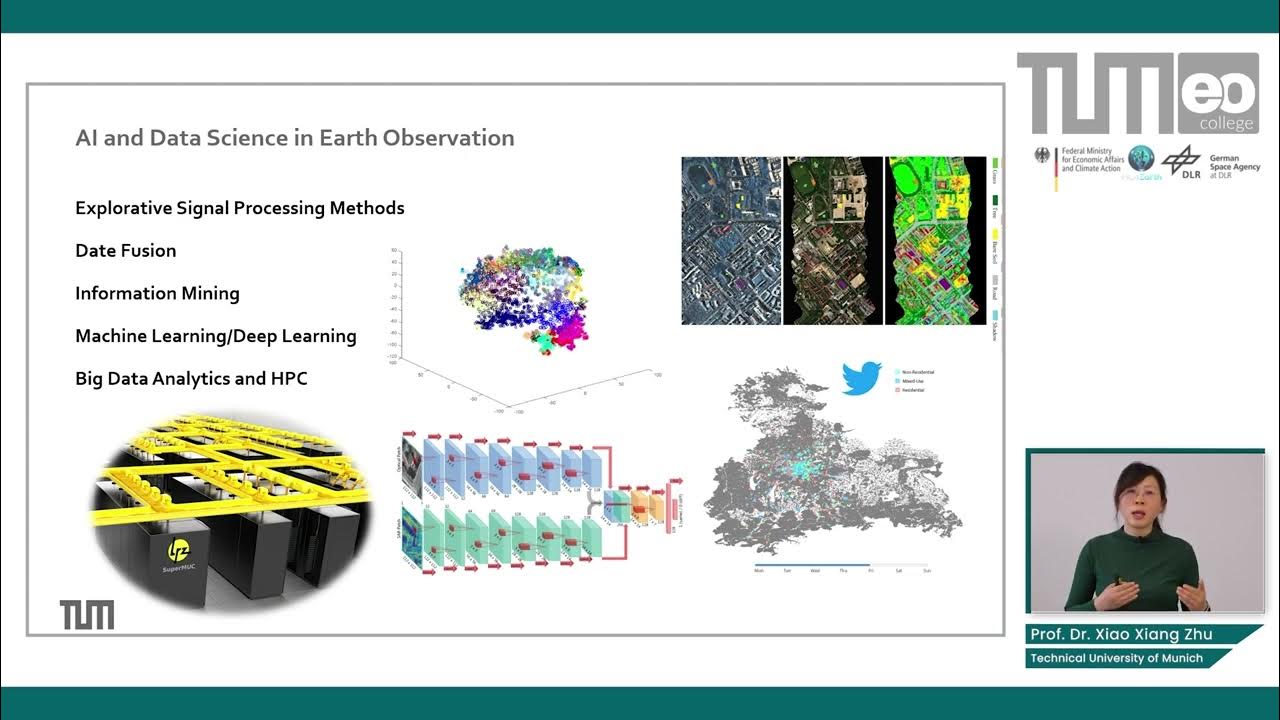
- 😀 The focus is on machine learning techniques applied to Earth observation, specifically in analyzing satellite images.
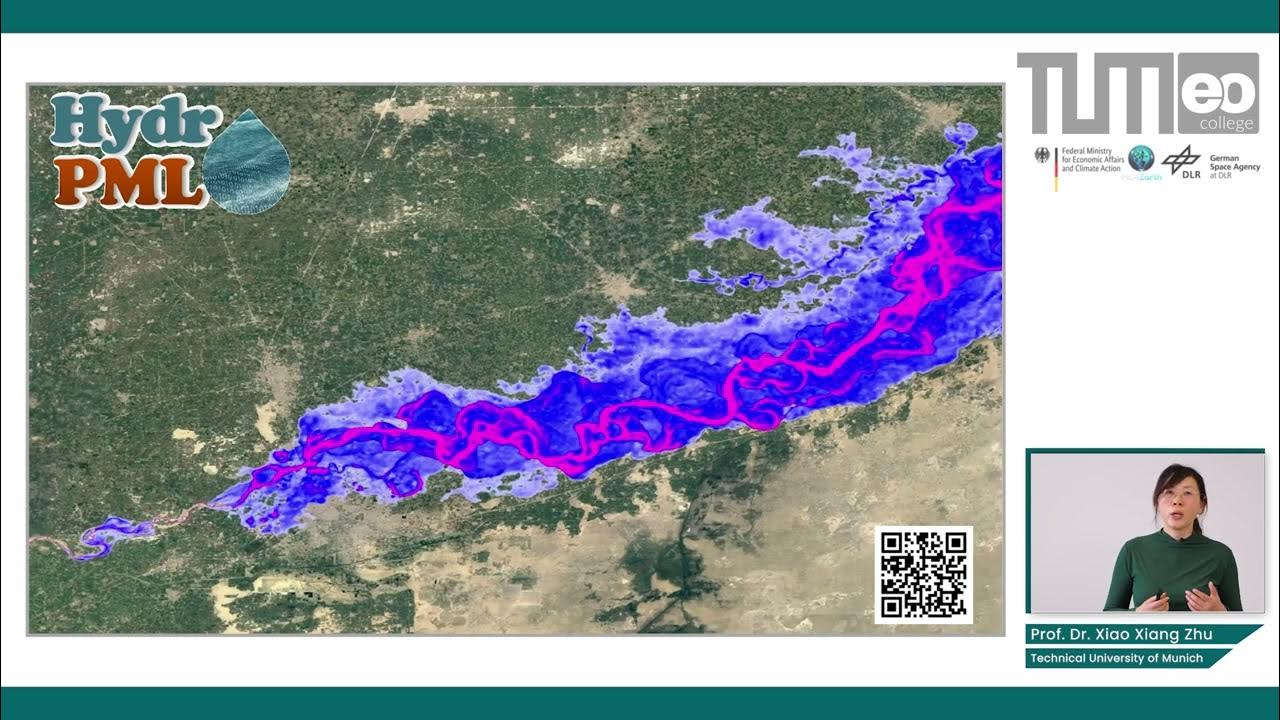
- 😀 One example of application is classifying local climate zones in Delhi using Sentinel-2 imagery, which correlates urban heat output to the density and morphology of urban structures.
- 😀 The classification model distinguishes urban agglomerations and settlements, showcasing the effectiveness of machine learning in mapping these zones.
- 😀 Another example presented is a segmentation problem using high-resolution PlanetScope imagery, where machine learning is used to detect and segment individual building footprints.
- 😀 Regression problems are also common, such as estimating canopy height from Sentinel-2 images, allowing for tree height estimations without field measurements.
- 😀 The main objective is to estimate a signal of interest (X) from input data (Y) using machine learning models.
- 😀 The video briefly introduces a scenario where the model is deterministic and linear, describing the relationship between Y, X, and a noise component.
- 😀 In the simple model described, the goal is to find the optimal estimator for X given the input Y and measurement noise.
- 😀 Viewers are encouraged to solve the exercise of finding the optimal estimator for X in the linear deterministic scenario as part of the learning process.
Q & A
What is the primary focus of Yan Yan Juan's lecture?
-The primary focus of the lecture is on Bayesian estimation in machine learning for Earth observation, with mathematical derivations for those with a background in the subject.
What is the local climate zone classification task demonstrated in the lecture?
-The task involves classifying the density and morphology of urban structures in a satellite image, with strong correlations to urban heat output, using machine learning models to classify the local climate zones in the image.
What is the significance of the 'local climate zones' in this context?
-Local climate zones describe the characteristics of urban areas, such as density and morphology, and are important for understanding urban heat output, which can influence local climates.
How does the machine learning model aid in local climate zone classification?
-The machine learning model helps by identifying patterns in satellite images, such as the distribution of rivers and urban areas, which are then used to classify different urban structures based on their density and morphology.
What is the difference between classification and segmentation problems in Earth observation?
-In classification, the goal is to assign a label to an entire image or region, whereas in segmentation, the goal is to classify each individual pixel (e.g., identifying the footprint of individual buildings in a high-resolution image).
What is the segmentation task presented in the lecture?
-The segmentation task involves using high-resolution satellite images and binary building labels to train a model that can segment and identify individual building footprints in the image.
How does regression in machine learning for Earth observation work?
-In regression, the goal is to predict a continuous variable from the input data. For example, a model can be used to estimate canopy height in an image, allowing for the estimation of tree heights without field measurements.
What does the lecturer mean by estimating a signal of interest X from the input data?
-The lecturer refers to estimating a signal (X) of interest, such as tree height or urban classification, from input data, typically in the form of images. This estimation is done through a model (F) that links the input data to the desired output.
What is the main challenge when estimating the signal X from the input data?
-The main challenge is that the signal estimation is noisy and uncertain due to the inherent noise in the measurements, and there is a need for an optimal estimator to obtain the best possible estimate of X.
What kind of model does the lecturer consider for the estimation problem?
-The lecturer considers a simple, deterministic, and linear model where the measurement Y is the product of a model matrix K and the signal X, plus some noise that is assumed to follow a Gaussian distribution.
Outlines

This section is available to paid users only. Please upgrade to access this part.
Upgrade NowMindmap

This section is available to paid users only. Please upgrade to access this part.
Upgrade NowKeywords

This section is available to paid users only. Please upgrade to access this part.
Upgrade NowHighlights

This section is available to paid users only. Please upgrade to access this part.
Upgrade NowTranscripts

This section is available to paid users only. Please upgrade to access this part.
Upgrade NowBrowse More Related Video

Bayesian Estimation in Machine Learning - Training and Uncertainties
AI and Data Science in Earth Observation - Methodological Research
AI and Data Science in Earth Observation - Introduction

Aprendizado de Máquinas - Conceitos Básicos de Aprendizado de Máquina

Introduction to ML: What is Machine Learning? | ML for Beginners

What is Machine Learning?
5.0 / 5 (0 votes)