Variación lineal: expresión algebraica, tabulación y gráfica.
Summary
TLDRThis video explores the concept of linear variation in mathematics, focusing on how two measurable quantities relate to each other through a straight-line graph. It explains key concepts like proportionality, independent and dependent variables, and how to represent linear variation algebraically using the formula y = mx + b. The video provides step-by-step instructions for solving problems related to linear variation, including creating tables, performing mathematical operations, and graphing the results. It also emphasizes the importance of practice and careful graphing techniques to ensure accurate results in understanding linear relationships.
Takeaways
- 😀 Linear variation occurs when two measurable quantities are related, and their relationship forms a straight line on a graph.
- 😀 The two quantities involved in linear variation are called variables, typically represented by 'x' and 'y'.
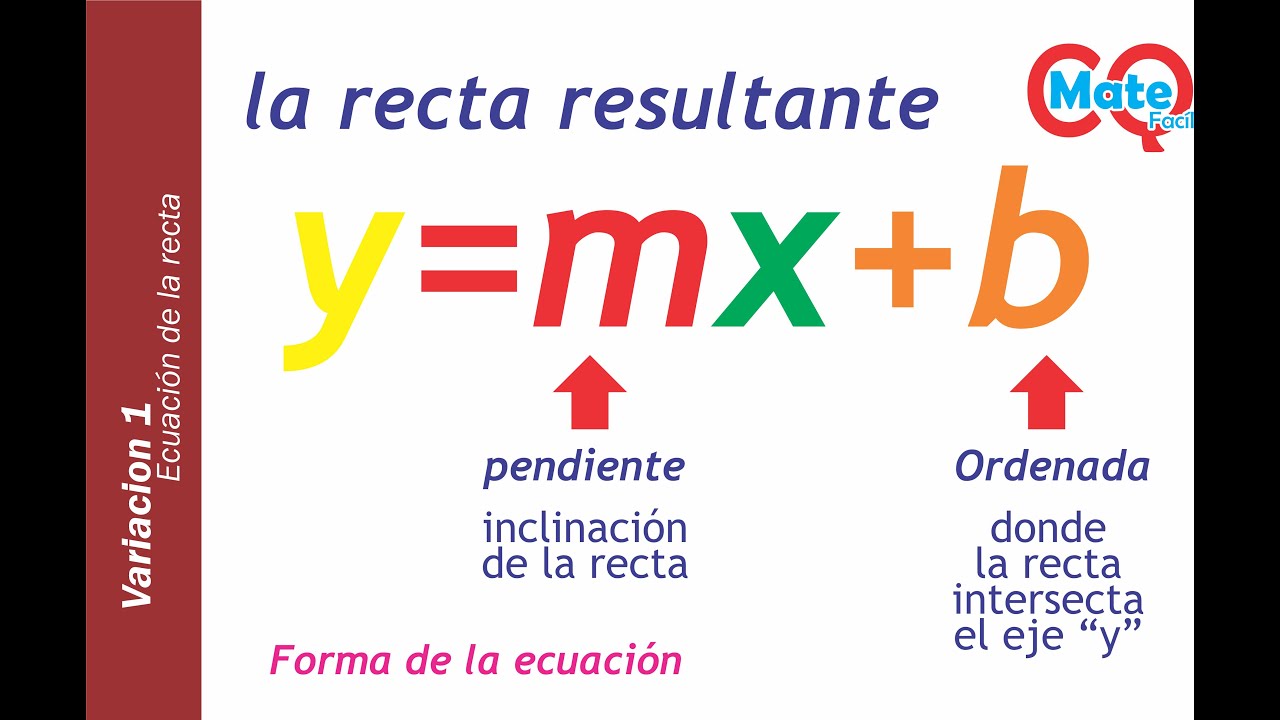
- 😀 The algebraic expression for linear variation is y = mx + b, where 'm' is the slope and 'b' is the y-intercept.
- 😀 Linear variation can be understood through proportional relationships, where one quantity increases or decreases in direct proportion to another.
- 😀 In a linear relationship, the 'x' variable is independent, and the 'y' variable is dependent on 'x'.
- 😀 A real-life example of linear variation is pricing based on quantity, like the cost of cable, where the total cost depends on the number of meters purchased.
- 😀 To solve linear variation problems, four steps are important: obtain the algebraic expression, create a table, perform mathematical operations, and graph the data.
- 😀 To form the algebraic expression, multiply the cost per unit by the number of units, which results in the total cost.
- 😀 In graphing, the x-axis represents the independent variable, and the y-axis represents the dependent variable, with the points forming a straight line if the relationship is linear.
- 😀 The graphing process requires careful attention to spacing and scaling on the Cartesian plane to ensure accurate representation of the data.
- 😀 Practicing with different linear variation problems helps improve understanding and mastery of the concept, especially through hands-on graphing and calculation.
Q & A
What is the definition of linear variation?
-Linear variation occurs when two quantities have a direct proportional relationship, and their graphical representation is a straight line.
What is the general equation used to represent linear variation?
-The general equation for linear variation is y = mx + b, where y is the dependent variable, x is the independent variable, m is the slope, and b is the y-intercept.
What does 'm' represent in the equation y = mx + b?
-'m' represents the slope of the line, which indicates the rate of change between the two variables.
What does 'b' represent in the equation y = mx + b?
-'b' represents the y-intercept, which is the point where the line crosses the y-axis. In many cases, for linear variation, 'b' is zero.
In the example provided, how is the cost of the cable related to the number of meters?
-The cost of the cable is directly proportional to the number of meters. For example, if one meter costs 12 pesos, two meters will cost 24 pesos, and so on.
What is the first step in solving a linear variation problem?
-The first step is to extract the algebraic expression that represents the relationship between the two variables.
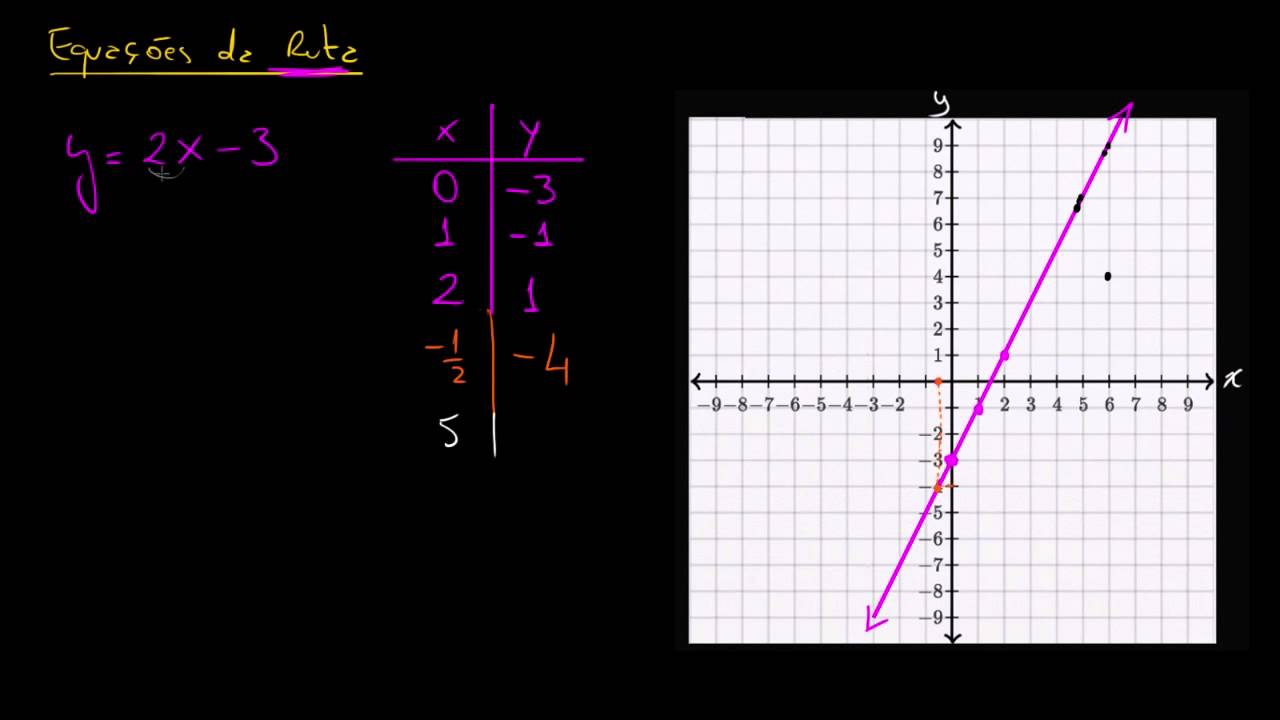
How do you create a table for a linear variation problem?
-To create a table, you list the possible values for the independent variable (x), and then use the algebraic expression to calculate the corresponding values for the dependent variable (y).
What is the third step in solving a linear variation problem?
-The third step is to perform the necessary mathematical operations, such as multiplication, to calculate the dependent variable's values.
How do you graph the results of a linear variation problem?
-To graph the results, plot the points from the table on a Cartesian plane, where the x-axis represents the independent variable and the y-axis represents the dependent variable. If the points form a straight line, the relationship is linear.
What advice is given for accurately graphing the points in a linear variation problem?
-It is recommended to use graph paper with uniform spaces, ensure proportional spacing on both axes, and use a ruler or straightedge to draw the line, ensuring that the graph is accurate and the line remains straight.
Outlines

This section is available to paid users only. Please upgrade to access this part.
Upgrade NowMindmap

This section is available to paid users only. Please upgrade to access this part.
Upgrade NowKeywords

This section is available to paid users only. Please upgrade to access this part.
Upgrade NowHighlights

This section is available to paid users only. Please upgrade to access this part.
Upgrade NowTranscripts

This section is available to paid users only. Please upgrade to access this part.
Upgrade NowBrowse More Related Video

Grafik Garis Lurus Hal 207-219 Bab 5 Persamaan Garis Lurus Kelas 8 Kurikulum Merdeka Belajar
Persamaan Garis Lurus (2) | Gradien Garis | Matematika Kelas 8

Kurikulum Merdeka Matematika Kelas 8 Bab 5 Persamaan Garis Lurus

Persamaan Garis Lurus [Part 1] - Mengenal Persamaan Garis Lurus
y=mx+b Ecuacíon de la recta, relación funcional
Equações lineares com duas variáveis e seus gráficos
5.0 / 5 (0 votes)