SPSS LENGKAP!! Perbedaan Analisis Korelasi dengan Analisis Regresi
Summary
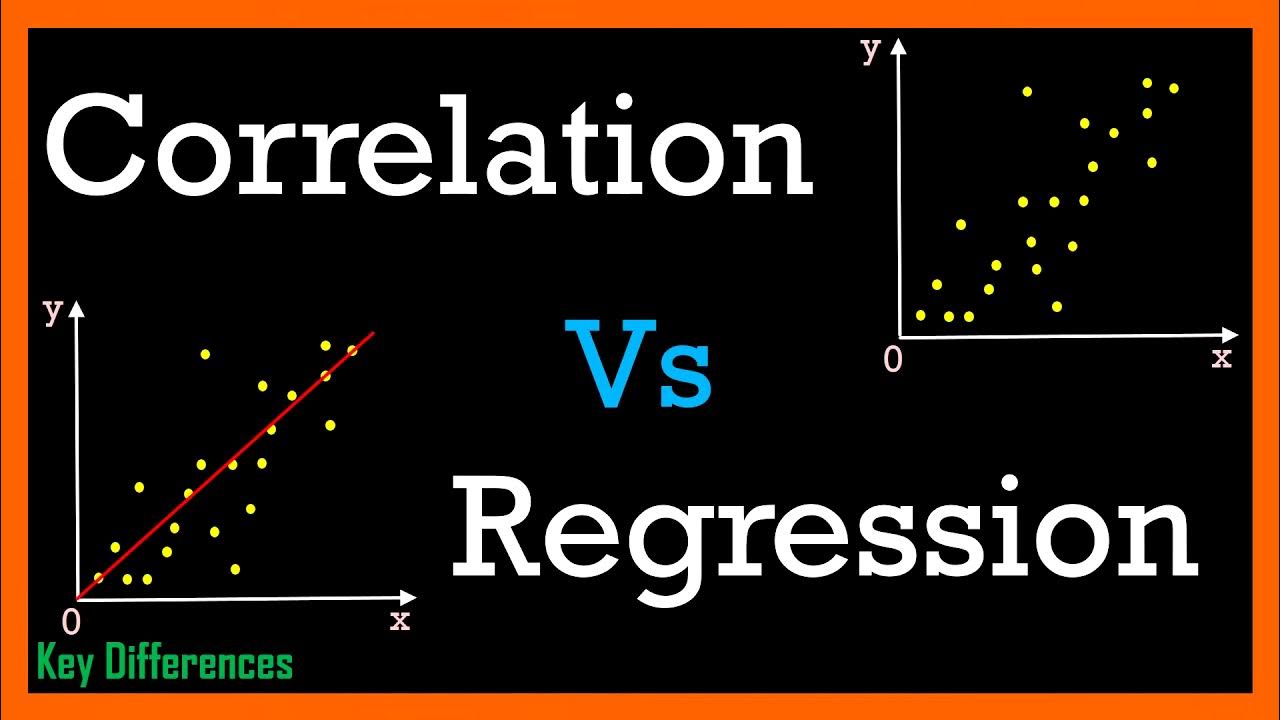
TLDRIn this video, the presenter explains the differences between correlation analysis and regression analysis. Correlation analysis is used to identify relationships between variables, while regression analysis predicts the extent or size of these relationships. The video covers how to interpret results using SPSS, demonstrating how to test and evaluate the significance of correlation values. The presenter also briefly touches on regression analysis, offering links to previous content for further exploration. Viewers are encouraged to subscribe and share the video for more insights into statistical analysis techniques.
Takeaways
- 😀 Correlation analysis helps determine if a relationship exists between two variables (e.g., student readiness and academic achievement).
- 😀 Regression analysis is used to predict the strength and direction of the relationship between variables.
- 😀 The purpose of correlation analysis is to examine the relationship, while regression analysis focuses on predicting the influence of one variable on another.
- 😀 For quantitative data, Pearson's correlation is used, while Spearman’s correlation is used for ordinal data.
- 😀 If the p-value in correlation analysis is less than 0.05, a significant relationship is considered to exist between the variables.
- 😀 The interpretation of Pearson’s correlation coefficient ranges from no correlation (0.00–0.20) to perfect correlation (0.81–1.00).
- 😀 In SPSS, the steps include entering data, labeling variables, and using the 'Analyze' function to calculate the correlation coefficient.
- 😀 The result of the correlation analysis provides a Pearson correlation coefficient and a p-value to assess the strength and significance of the relationship.
- 😀 If the Pearson correlation is greater than the R-table value, the relationship is considered significant.
- 😀 A positive or negative sign in the correlation coefficient indicates whether the relationship is positive or negative between the variables.
Q & A
What is the main difference between correlation analysis and regression analysis?
-The main difference is that correlation analysis aims to determine if there is a relationship between two or more variables, while regression analysis is used to predict the magnitude and direction of the relationship between the variables.
What is the purpose of correlation analysis?
-The purpose of correlation analysis is to identify whether there is a relationship between two variables, such as how one variable affects or is associated with another.
What is the goal of regression analysis?
-The goal of regression analysis is to predict how much or how far one variable (X) influences another variable (Y).
Which statistical method is used for interval or ratio scale data in correlation analysis?
-For interval or ratio scale data, Pearson correlation (also known as product-moment correlation) is used in correlation analysis.
What type of data is suitable for Spearman correlation?
-Spearman correlation is used for ordinal scale data and is a non-parametric statistical method.
How do we interpret the significance value in correlation analysis?
-If the significance value (p-value) is less than 0.05, it indicates that the variables are correlated. If the p-value is greater than 0.05, it indicates no significant correlation.
How do we determine the strength of the correlation in Pearson's correlation?
-The strength of the correlation is determined by the Pearson correlation value. A correlation of 0.00 to 0.20 indicates no correlation, 0.21 to 0.40 indicates weak correlation, 0.41 to 0.60 indicates moderate correlation, 0.61 to 0.80 indicates strong correlation, and 0.81 to 1.00 indicates a perfect correlation.
What does the term 'degree of correlation' refer to in the context of Pearson correlation?
-The 'degree of correlation' refers to the strength of the relationship between the variables, measured by the Pearson correlation coefficient. It categorizes the relationship as weak, moderate, strong, or perfect.
In the example, what was the correlation between student readiness and academic performance?
-In the example, the Pearson correlation value was 0.731, indicating a strong positive relationship between student readiness and academic performance.
What happens if the Pearson correlation value is exactly 0.05?
-If the Pearson correlation value is exactly 0.05, the decision is made by comparing the correlation value with the table's r-value. If the correlation value is greater than the r-table value, there is a relationship. Otherwise, there is no relationship.
Outlines

This section is available to paid users only. Please upgrade to access this part.
Upgrade NowMindmap

This section is available to paid users only. Please upgrade to access this part.
Upgrade NowKeywords

This section is available to paid users only. Please upgrade to access this part.
Upgrade NowHighlights

This section is available to paid users only. Please upgrade to access this part.
Upgrade NowTranscripts

This section is available to paid users only. Please upgrade to access this part.
Upgrade NowBrowse More Related Video

Cara Menghitung Analisis Regresi Sederhana secara Manual

Correlation Vs Regression: Difference Between them with definition & Comparison Chart

Descriptive Statistics, Correlation Analysis and Regression Analysis by Using Microsoft Excel

一夜。統計學:相關分析

Metode Penelitian Korelasi

Analisis Regresi dan Korelasi
5.0 / 5 (0 votes)