Menentukan Jangkauan, Simpangan Rata-Rata, Variansi (Ragam), Simpangan Baku dan Koefisiens Variansi
Summary
TLDRThis video provides a comprehensive tutorial on calculating key statistical measures, including range, mean, mean deviation, variance, standard deviation, and coefficient of variance. Using a sample dataset, the tutorial guides viewers through each calculation step-by-step, explaining how to derive each value and its significance in statistical analysis. The instructor demonstrates concepts with practical examples, making it easier to understand these foundational statistics. The video is ideal for those looking to improve their understanding of data analysis and statistical calculations.
Takeaways
- 😀 The script explains how to calculate various statistical measures, such as range, mean deviation, variance, standard deviation, and coefficient of variation, using a given data set.
- 😀 Range is calculated as the difference between the maximum and minimum values of the data set. In this case, it's 10 - 3 = 7.
- 😀 Mean deviation (simpangan rata-rata) is the average of the absolute differences between each data point and the mean of the data set.
- 😀 The mean of the data set is calculated by summing all the values and dividing by the number of data points. For the given data, the mean is 6.
- 😀 The mean deviation is calculated by taking the absolute differences of each data point from the mean, summing them, and dividing by the total number of data points. The result is 2.
- 😀 Variance (ragam) is the average of the squared differences between each data point and the mean. For the data, the variance is 5.67.
- 😀 Standard deviation (simpangan baku) is the square root of the variance. In this case, the standard deviation is approximately 2.38.
- 😀 The coefficient of variation (koefisien variansi) is calculated by dividing the standard deviation by the mean and multiplying by 100 to express it as a percentage. The result is about 39.67%.
- 😀 The formula for variance involves squaring the differences between each data point and the mean, and then averaging the results.
- 😀 The script emphasizes the importance of understanding these measures in statistics to analyze and interpret data distributions effectively.
Q & A
What is the range in statistics and how is it calculated?
-The range in statistics is the difference between the largest and smallest values in a dataset. It is calculated by subtracting the smallest value (X_min) from the largest value (X_max). For example, in the dataset [3, 8, 5, 6, 4, 10], the range is 10 - 3 = 7.
How do you calculate the mean deviation in a dataset?
-The mean deviation is the average of the absolute differences between each data point and the mean. To calculate it, first find the mean of the dataset, then calculate the absolute differences between each data point and the mean, and finally, find the average of those absolute differences.
What is the formula for mean deviation?
-The formula for mean deviation is: Mean Deviation = Σ |X_i - X̄| / N, where X_i represents each data point, X̄ is the mean of the dataset, and N is the total number of data points.
How is variance different from mean deviation?
-Variance measures the average of the squared deviations from the mean, whereas mean deviation is the average of the absolute deviations from the mean. The key difference is that variance squares the deviations, making it more sensitive to larger deviations.
What is the formula for variance?
-The formula for variance is: Variance (σ^2) = Σ (X_i - X̄)² / N, where X_i represents each data point, X̄ is the mean of the dataset, and N is the number of data points.
How do you calculate standard deviation from variance?
-Standard deviation is the square root of the variance. After calculating the variance, take the square root to obtain the standard deviation. The formula is: Standard Deviation (σ) = √Variance.
Why is standard deviation used instead of variance in some cases?
-Standard deviation is used instead of variance because it is in the same unit of measurement as the original data, making it easier to interpret. Variance is expressed in squared units, which can be less intuitive.
What does the coefficient of variation represent?
-The coefficient of variation (CV) represents the ratio of the standard deviation to the mean, expressed as a percentage. It is used to compare the relative variability of datasets with different units or means. The formula is: Coefficient of Variation = (Standard Deviation / Mean) × 100%.
How do you calculate the coefficient of variation?
-To calculate the coefficient of variation, divide the standard deviation by the mean, and then multiply by 100 to express it as a percentage. For example, if the standard deviation is 2.38 and the mean is 6, the coefficient of variation is (2.38 / 6) × 100 = 39.67%.
What is the significance of the coefficient of variation?
-The coefficient of variation helps compare the degree of variation between datasets, even when they have different units or scales. It allows for easier comparison of the relative variability of different datasets.
Outlines

This section is available to paid users only. Please upgrade to access this part.
Upgrade NowMindmap

This section is available to paid users only. Please upgrade to access this part.
Upgrade NowKeywords

This section is available to paid users only. Please upgrade to access this part.
Upgrade NowHighlights

This section is available to paid users only. Please upgrade to access this part.
Upgrade NowTranscripts

This section is available to paid users only. Please upgrade to access this part.
Upgrade NowBrowse More Related Video
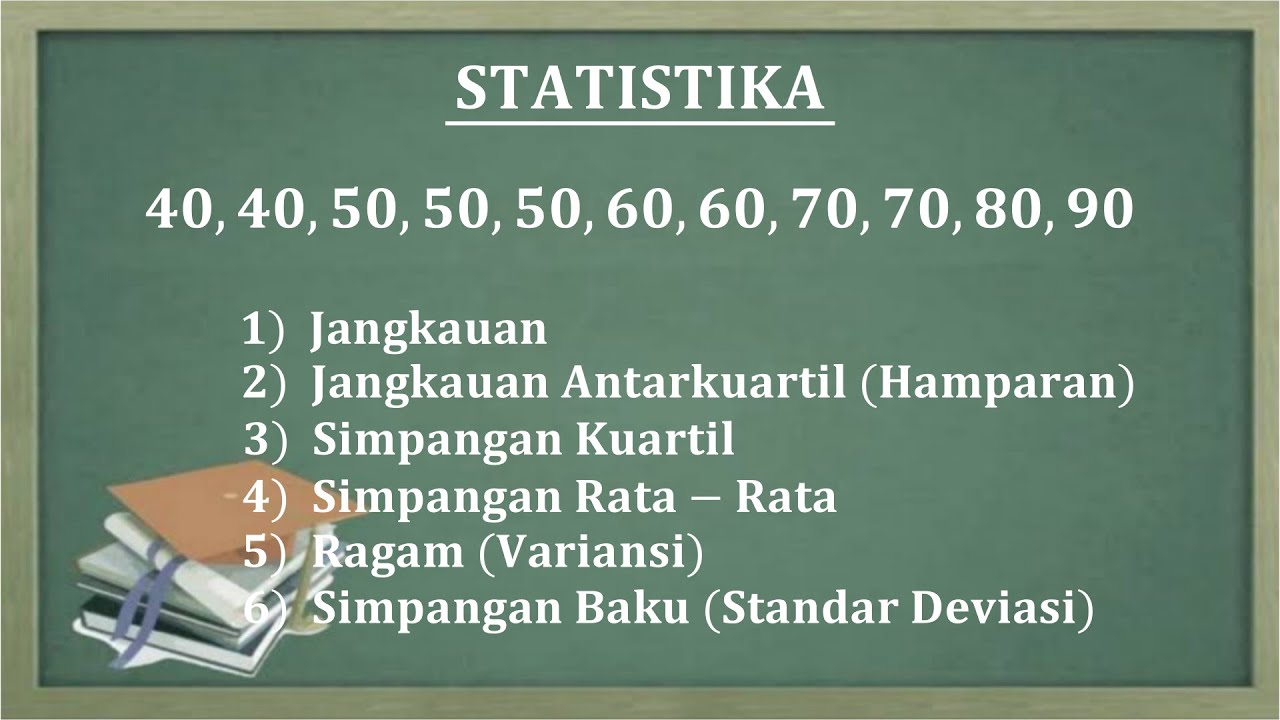
JANGKAUAN, HAMPARAN, SIMPANGAN KUARTIL, SIMPANGAN RATA RATA, RAGAM DAN STANDAR DEVIASI
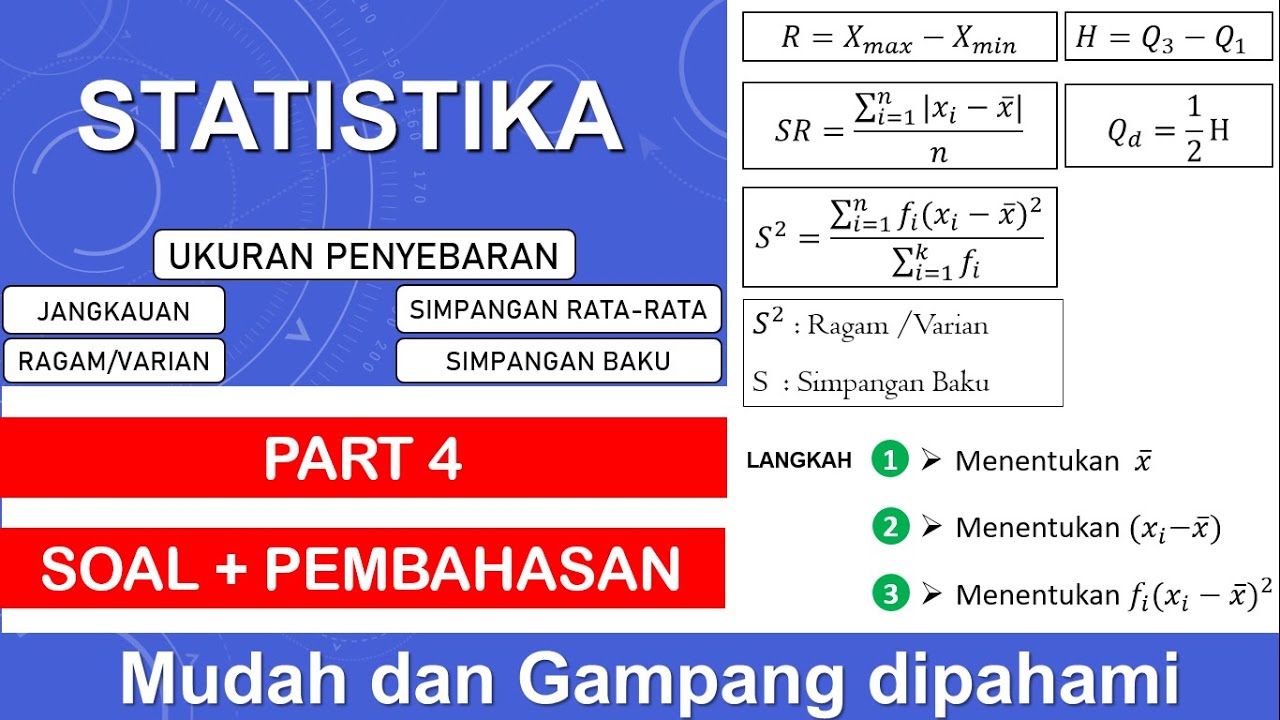
Statistika Part. 4 | Ukuran Penyebaran, Ragam, Varian, Simpangan Rata-rata, Simpangan Baku
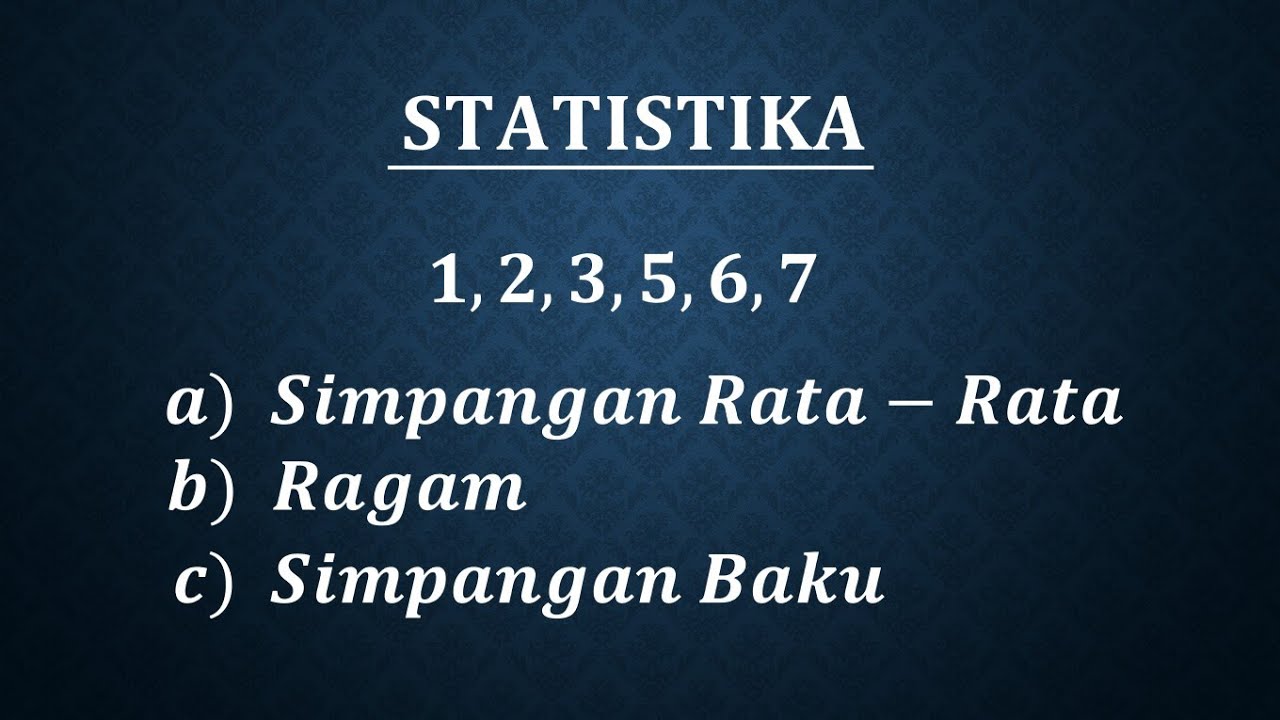
Simpangan rata-rata, ragam dan simpangan baku data tunggal
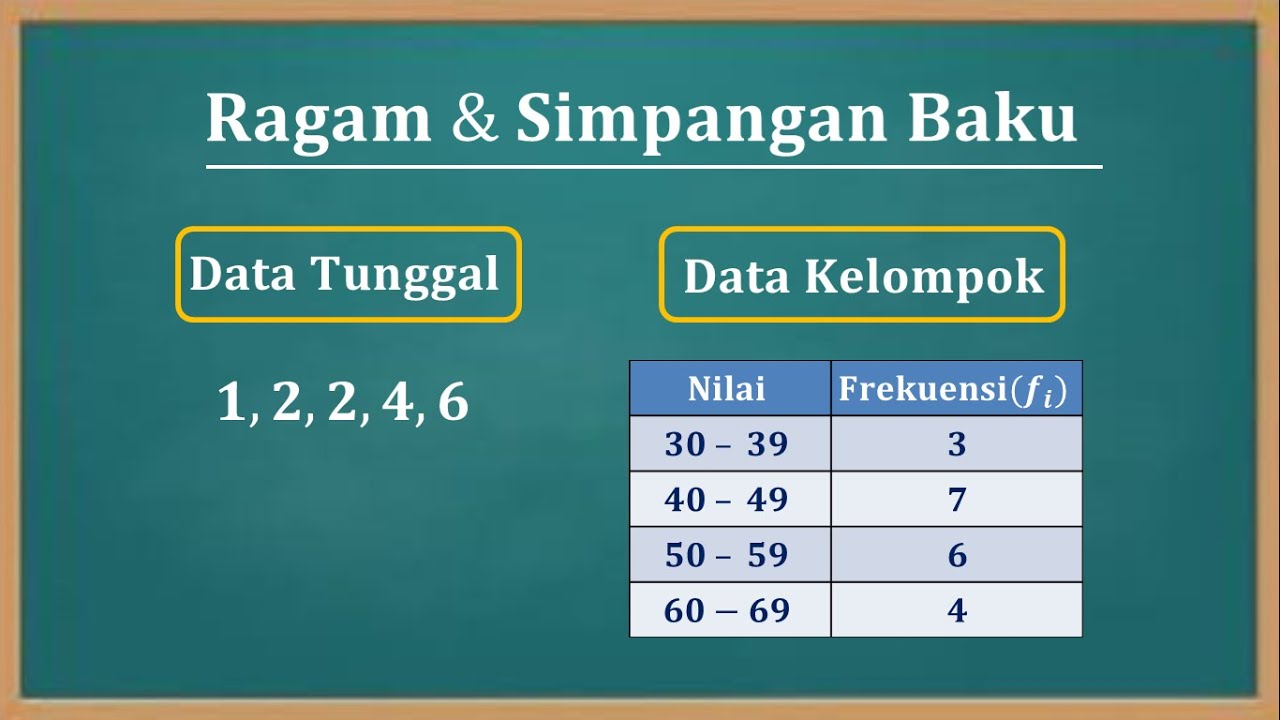
Cara menentukan nilai varian (Ragam) dan Standar deviasi (Simpangan baku) data tunggal dan kelompok
ESTADISTICA DESCRIPTIVA.- PARAMETROS DE CENTRALIZACION Y DISPERSION.

Ilmu Data #5 - Varians dan Standar Deviasi
5.0 / 5 (0 votes)