Statistika - Ukuran Pemusatan Data Tunggal (Mean, Median, Modus)
Summary
TLDRIn this educational video, viewers learn about measures of central tendency, including mean, median, and mode. The video explains how to calculate the mean for both simple and weighted data, along with step-by-step examples. It also demonstrates how to find the median, especially when there is an even number of data points, and identifies the mode as the most frequent value. The presenter covers real-life examples to help students understand these concepts and encourages them to engage with the content by liking, subscribing, and sharing.
Takeaways
- 😀 The video teaches how to calculate and understand measures of central tendency: mean, median, and mode for single data sets.
- 😀 The mean is calculated by dividing the sum of all data values by the total number of data points.
- 😀 For grouped frequency tables, the mean is calculated using the formula: Σ(f * x) / Σf, where 'f' is frequency and 'x' is the data value.
- 😀 Example calculations are provided to demonstrate how to find the mean from raw data and frequency tables.
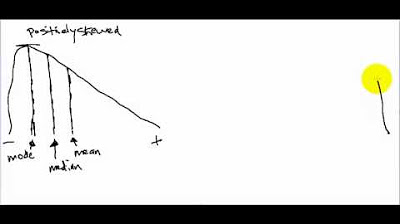
- 😀 The median is the middle value when data is arranged in ascending order; if there are two middle values, the median is their average.
- 😀 In the case of an odd number of data points, the median is the single middle value.
- 😀 Modus (mode) refers to the most frequently occurring data value in a set.
- 😀 To calculate the mean for combined groups, multiply the number of data points in each group by their respective means and then divide by the total number of data points.
- 😀 When a new data point is added, the new mean can be calculated by adjusting the total sum and dividing by the new total number of data points.
- 😀 The video provides several examples, showing the steps for finding the mean, median, and mode in both raw and grouped data.
Q & A
What is the main purpose of measures of central tendency?
-Measures of central tendency provide a representative value for a data sample, summarizing the data in a way that can reflect the overall characteristics of a population.
What are the three types of measures of central tendency discussed in the video?
-The three types of measures of central tendency discussed in the video are Mean (Rataan), Median, and Mode (Modus).
How is the Mean (Rataan) calculated?
-The Mean is calculated by adding all data values and dividing by the number of data points. In the case of a frequency table, the formula is: Mean (x̄) = Σ(f * x) / Σf, where f is the frequency and x is the data value.
Can you explain how to calculate the Mean from a table with frequency data?
-To calculate the Mean from a frequency table, multiply each data value by its corresponding frequency, sum all the results, and then divide by the total sum of the frequencies.
What is the Median, and how is it calculated?
-The Median is the middle value of a data set when the data is arranged in ascending order. If the data set has an odd number of values, the median is the middle one. If the data set has an even number of values, the median is the average of the two middle values.
How do you find the Median when the data set has two middle values?
-When the data set has two middle values, the Median is calculated by adding the two middle values together and dividing by 2.
What is the Mode, and how do you determine it from a data set?
-The Mode is the value that appears most frequently in a data set. To find the Mode, identify the value(s) that have the highest frequency.
What does the script suggest when dealing with a data set that has multiple modes?
-If a data set has multiple values with the highest frequency, it is referred to as multimodal, and each of these values is considered a Mode.
How do you calculate the total Mean when combining two groups with different means?
-To calculate the total Mean for two groups, use the formula: (N1 * X1 + N2 * X2) / (N1 + N2), where N1 and N2 are the group sizes, and X1 and X2 are the means of each group.
What happens to the Mean when a new data point is added to the group?
-When a new data point is added to the group, the Mean is recalculated by adding the new data value to the total sum of the data and then dividing by the new total number of data points.
Outlines

This section is available to paid users only. Please upgrade to access this part.
Upgrade NowMindmap

This section is available to paid users only. Please upgrade to access this part.
Upgrade NowKeywords

This section is available to paid users only. Please upgrade to access this part.
Upgrade NowHighlights

This section is available to paid users only. Please upgrade to access this part.
Upgrade NowTranscripts

This section is available to paid users only. Please upgrade to access this part.
Upgrade NowBrowse More Related Video
Measure of Central Tendency - What? Why? How? || Mean || Median || Mode || Statistics for Beginners

UKURAN PEMUSATAN DATA BERKELOMPOK | Rataan Median Modus Kuartil Desil Persentil
Skewed Distributions and Mean, Median, and Mode (Measures of Central Tendency)
Ch 3 Lecture Video, Fall 2024: Measures of Central Tendency
Statistika #3 Ukuran Pemusatan : Mean - Modus - Median | Kelas X Fase E Kurikulum Merdeka
Mean, Median and Mode in Statistics | Statistics Tutorial | MarinStatsLectures
5.0 / 5 (0 votes)