Test of Correlation using JAMOVI
Summary
TLDRThis video tutorial covers commonly used statistical tools for data analysis, with a focus on correlation methods. The presenter explains various correlation techniques depending on the type of variables involved, such as Pearson, Spearman, and Gamma correlations. The video highlights how to interpret correlation coefficients and the importance of determining statistical significance using p-values. Practical examples are provided, such as examining the relationship between attitude and practices regarding comprehensive sex education, and the relationship between temperature and fruit shake sales. The video emphasizes the distinction between correlation and causation in research.
Takeaways
- 😀 Correlation analysis is used to examine the relationship between two variables, describing the strength and direction of the relationship.
- 😀 The direction of the correlation is indicated by the sign of the correlation coefficient: positive means both variables increase together, while negative means one increases and the other decreases.
- 😀 The strength of the correlation is shown by the absolute value of the coefficient, with values closer to 1 indicating a stronger relationship.
- 😀 Different correlational methods are applied based on the types of variables involved (e.g., nominal, ordinal, or continuous).
- 😀 Pearson's correlation is used when both variables are quantitative and normally distributed, while Spearman's correlation is used for ordinal or non-normally distributed data.
- 😀 A p-value lower than 0.05 indicates a significant relationship between variables, while a p-value above 0.05 suggests no significant relationship.
- 😀 In practice, the median (not the mean) is used to analyze ordinal data or Likert scale responses, as these are ordinal and not normally distributed.
- 😀 The Spearman correlation is ideal when dealing with ordinal data or non-normal quantitative data, and it helps determine the relationship between variables in such cases.
- 😀 The relationship between variables should be reported with both the correlation coefficient (r) and the p-value to determine both the strength and significance of the relationship.
- 😀 Correlation does not imply causation. For example, a positive correlation between temperature and fruit shake sales does not mean temperature causes an increase in sales. Other factors could be influencing the relationship.
Q & A
What are the different types of correlation methods discussed in the lecture?
-The lecture covers several types of correlation methods: Fe correlation, biserial correlation, gamma correlation, point-biserial correlation, Spearman rank correlation, and Pearson product-moment correlation. Each method applies to specific combinations of variable types such as nominal, ordinal, and continuous variables.
What is the purpose of correlation analysis?
-Correlation analysis determines the relationship between two variables, describing the strength and direction of the relationship. It does not establish causality, meaning it does not determine cause and effect.
How is the correlation coefficient interpreted?
-The correlation coefficient ranges from 0 to 1 and can be positive or negative. The sign indicates the direction (positive for an increase in both variables, negative for an inverse relationship), and the absolute value indicates the strength of the relationship, with 0 representing no relationship and 1 representing a perfect relationship.
When should Pearson's correlation be used?
-Pearson's correlation is used when both variables are quantitative (interval or ratio data) and the data is normally distributed.
What is the role of Spearman’s correlation?
-Spearman's correlation is used when the data is ordinal or not normally distributed. It is used to determine the relationship between one ordinal and one continuous variable or two ordinal variables.
What does a p-value greater than 0.05 signify in a correlation test?
-A p-value greater than 0.05 indicates that the correlation is not statistically significant, meaning the relationship between the variables is likely due to chance.
What does a correlation coefficient of -0.1442 imply about the relationship between two variables?
-A correlation coefficient of -0.1442 indicates a very weak negative relationship between the variables. This suggests that as one variable increases, the other tends to decrease slightly, but the relationship is not strong.
How should the results of a correlation analysis be presented in a research paper?
-In a research paper, the results should include the correlation matrix and statistical interpretation, noting the correlation coefficient, p-value, and the strength and significance of the relationship. Additionally, the implications, theoretical grounding, and comparison with related studies should be discussed.
Why is the median used instead of the mean in the example provided for attitude and perception?
-The median is used instead of the mean because the data for attitude and perception is ordinal, and the median is a more appropriate measure of central tendency for ordinal data.
What does the result of Pearson's correlation of 0.739 and p-value of 0.0060 suggest?
-A Pearson correlation of 0.739 indicates a strong positive relationship between the two variables. The p-value of 0.0060, which is less than 0.05, shows that the relationship is statistically significant.
Outlines

This section is available to paid users only. Please upgrade to access this part.
Upgrade NowMindmap

This section is available to paid users only. Please upgrade to access this part.
Upgrade NowKeywords

This section is available to paid users only. Please upgrade to access this part.
Upgrade NowHighlights

This section is available to paid users only. Please upgrade to access this part.
Upgrade NowTranscripts

This section is available to paid users only. Please upgrade to access this part.
Upgrade NowBrowse More Related Video
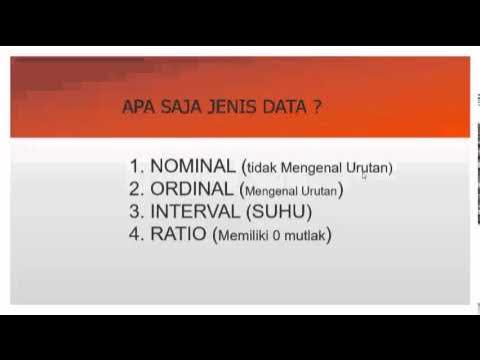
statistika dasar | pengantar statistik
Processed Data in IB Biology IA EXPLAINED by an IB Examiner | Part 9/12
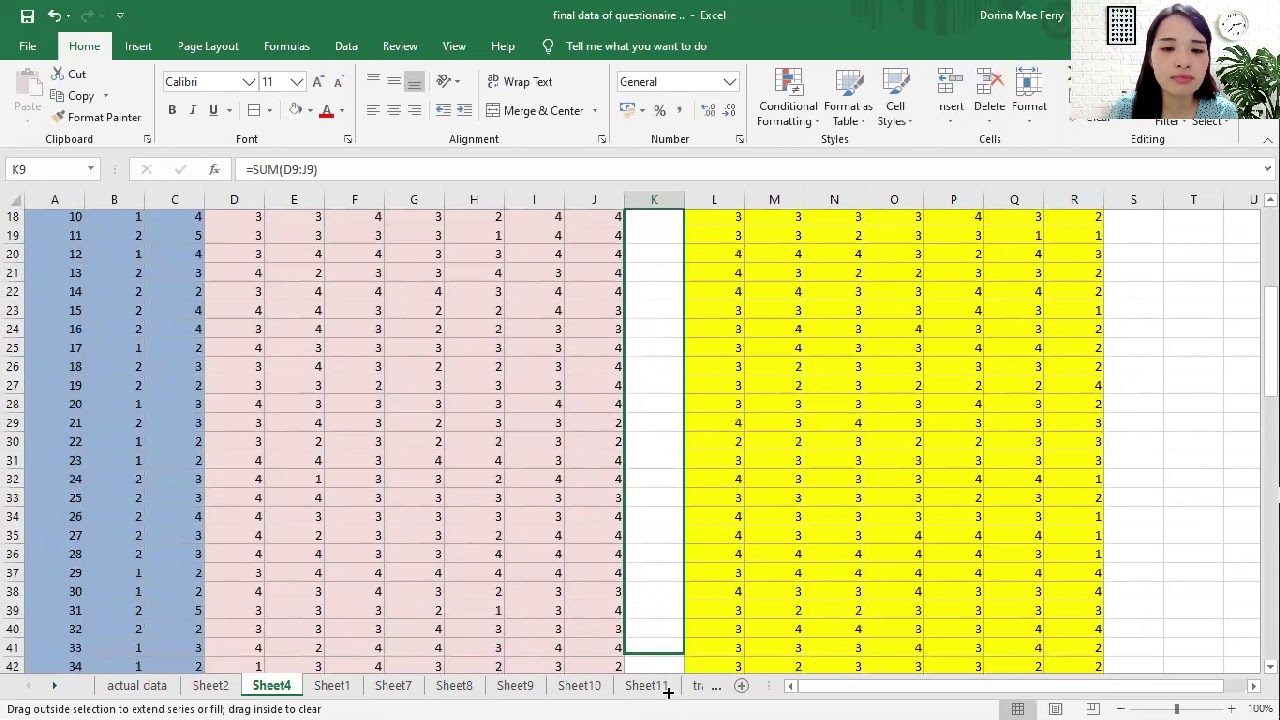
How to Tally, Encode, and Analyze your Data using Microsoft Excel (Chapter 4: Quantitative Research)
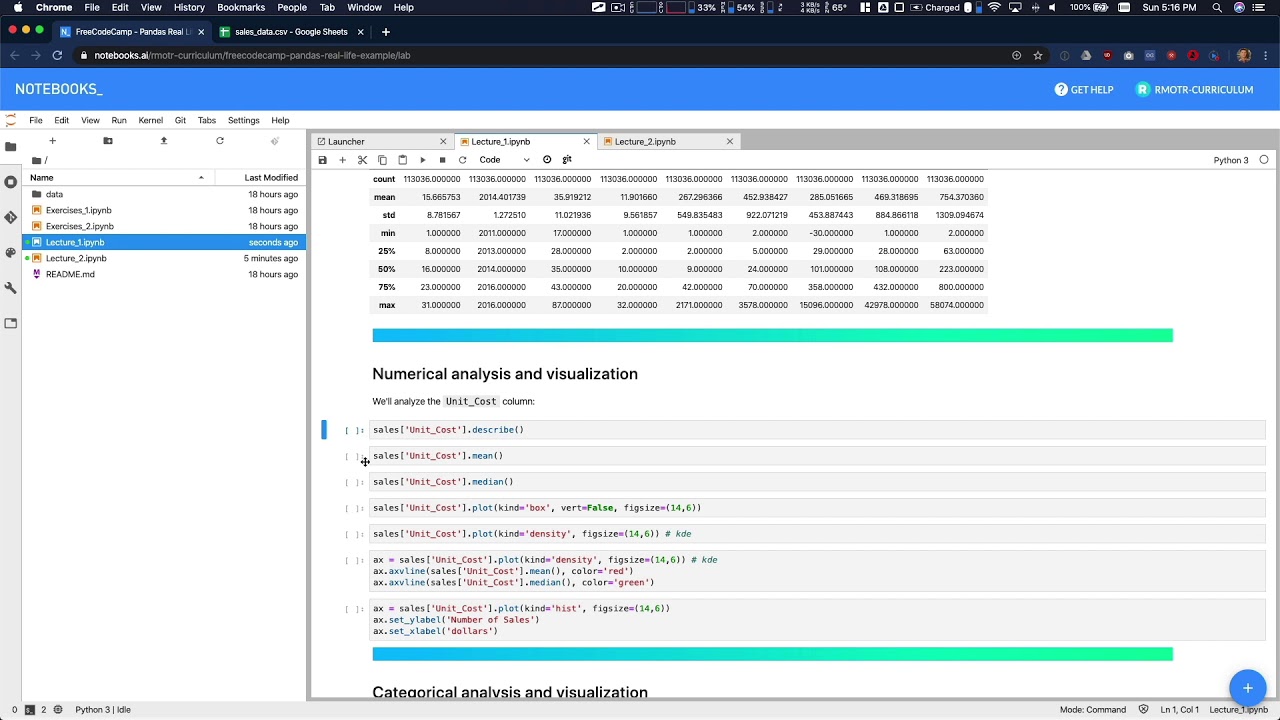
Data Analysis Example A - Data Analysis with Python
04 Correlation in SPSS – SPSS for Beginners
一夜。統計學:敘述統計
5.0 / 5 (0 votes)