Moderation Regression Analysis SPSS – Moderated Regression Analysis (MRA)
Summary
TLDRIn this video, the speaker explains moderated regression analysis (MRA) using SPSS. They introduce key concepts such as independent, dependent, and moderating variables, and demonstrate how leadership style moderates the relationship between compensation, communication, and organizational commitment. The speaker walks through two regression equations—one analyzing the relationship between independent variables and the dependent variable, and another examining the interaction between independent variables and the moderating variable. Using SPSS, they interpret the significance values and R-squared results, concluding that leadership style strengthens the impact of compensation and communication on organizational commitment.
Takeaways
- 😀 Moderated Regression Analysis (MRA) examines the interaction between independent and moderating variables, which can either strengthen or weaken the impact of the independent variable on the dependent variable.
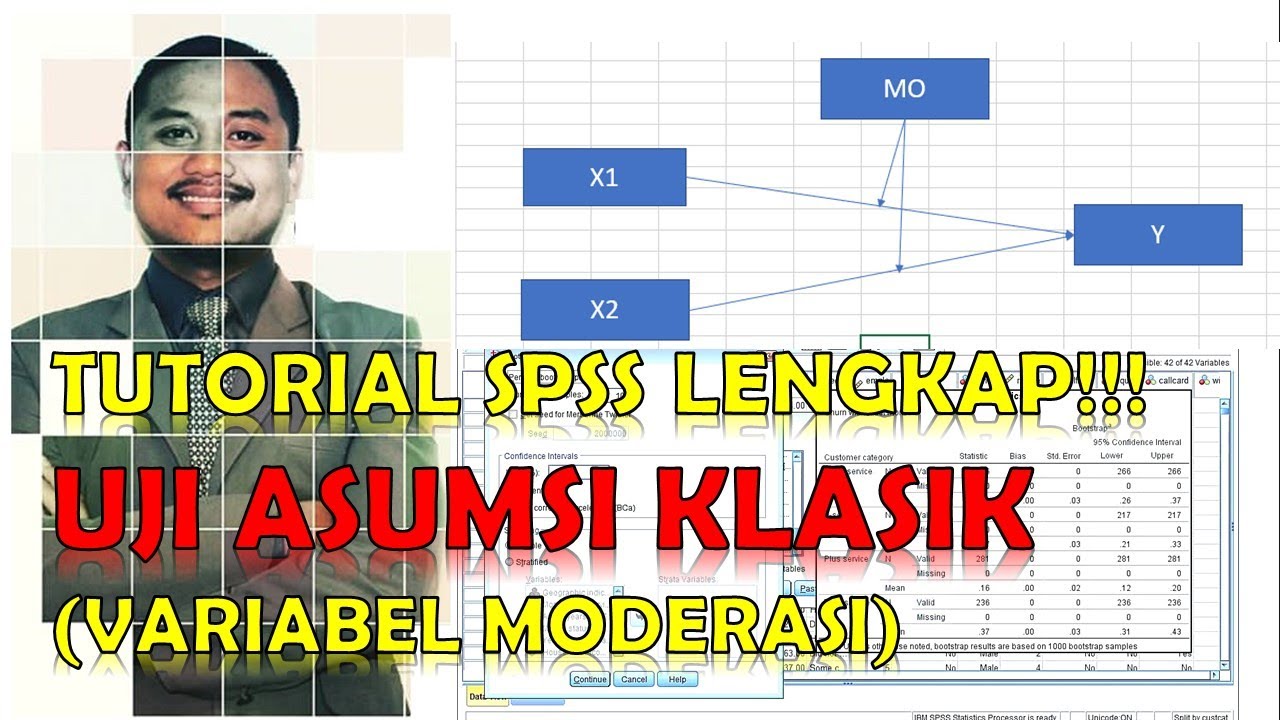
- 😀 MRA involves three types of variables: independent, dependent, and moderating variables. The moderating variable influences the relationship between the independent and dependent variables.
- 😀 The case example used in the script involves compensation and communication as independent variables, organizational commitment as the dependent variable, and leadership style as the moderating variable.
- 😀 In the first regression equation, the independent variables (compensation and communication) are regressed against the dependent variable (organizational commitment).
- 😀 The significance value of compensation in the first regression equation is 0.000, which is less than 0.05, meaning it has a significant effect on organizational commitment.
- 😀 Similarly, the communication variable also has a significance value of 0.000 in the first regression equation, indicating it significantly affects organizational commitment.
- 😀 The R-square value in the first regression is 0.655, meaning that compensation and communication together account for 65.5% of the variation in organizational commitment.
- 😀 The second regression equation includes the interaction terms between the independent variables and the moderating variable (leadership style). This analysis helps assess the moderation effect.
- 😀 The significance value of the interaction between compensation and leadership style in the second regression is 0.000, suggesting that leadership style significantly moderates the relationship between compensation and organizational commitment.
- 😀 The second regression's R-square value is 0.839, showing that after adding the moderating variable (leadership style), compensation and communication together explain 83.9% of the variation in organizational commitment.
Q & A
What is Moderated Regression Analysis (MRA)?
-Moderated Regression Analysis (MRA) is a statistical technique used to test the interaction between an independent variable and a moderating variable, determining if the moderating variable strengthens or weakens the relationship between the independent and dependent variables.
What are the three key variables in Moderated Regression Analysis?
-The three key variables in MRA are the independent variable, the dependent variable, and the moderating variable.
What role does the moderating variable play in MRA?
-The moderating variable influences the strength or direction of the relationship between the independent variable and the dependent variable, either strengthening or weakening the effect.
Can you explain the example case used in the video for MRA?
-The example case in the video is about examining the effect of compensation and communication on organizational commitment, with leadership style serving as a moderating variable.
What are the two regression equations used in the analysis?
-The first regression equation involves regressing the independent variables (compensation and communication) onto the dependent variable (organizational commitment). The second equation includes both the independent variables and their interaction with the moderating variable (leadership style) to assess their combined effect on organizational commitment.
What are the steps for conducting the first regression analysis in SPSS?
-In SPSS, you select 'Analyze', then 'Regression', and choose 'Linear'. The organizational commitment variable is placed in the dependent column, and the compensation and communication variables are placed in the independent column. After selecting 'OK', the regression output appears.
How do you interpret the significance value of the compensation and communication variables?
-A significance value less than 0.05 indicates that the variable has a significant effect on the dependent variable. In this case, both compensation and communication have significance values of 0.000, indicating they significantly influence organizational commitment.
What is the meaning of the R-squared value in the first regression output?
-The R-squared value of 0.655 means that 65.5% of the variability in organizational commitment is explained by compensation and communication.
How do you create the interaction variables in SPSS for the second regression equation?
-To create interaction variables, you use the 'Transform' menu, select 'Compute Variable', and multiply the independent variables (compensation or communication) by the moderating variable (leadership style). The resulting interaction variables are labeled and used in the second regression analysis.
How is the moderating effect of leadership style assessed in the second regression equation?
-In the second regression equation, the interaction between compensation and leadership style, and between communication and leadership style, are examined. If the significance value of these interactions is less than 0.05, it indicates that leadership style moderates the effects of compensation and communication on organizational commitment.
What does the R-squared value of 0.839 indicate in the second regression analysis?
-An R-squared value of 0.839 means that after considering the moderating effect of leadership style, 83.9% of the variability in organizational commitment is explained by the combination of compensation, communication, and their interactions with leadership style.
What can be concluded from the second regression analysis about the moderating effect of leadership style?
-It can be concluded that leadership style significantly strengthens the effect of both compensation and communication on organizational commitment, as evidenced by the significant interaction terms and the increased R-squared value.
Outlines

This section is available to paid users only. Please upgrade to access this part.
Upgrade NowMindmap

This section is available to paid users only. Please upgrade to access this part.
Upgrade NowKeywords

This section is available to paid users only. Please upgrade to access this part.
Upgrade NowHighlights

This section is available to paid users only. Please upgrade to access this part.
Upgrade NowTranscripts

This section is available to paid users only. Please upgrade to access this part.
Upgrade NowBrowse More Related Video
TUTORIAL UJI ASUMSI KLASIK VARIABEL MODERASI DENGAN SPSS -TERBARU ❗❗❗

Tutorial Uji Asumsi Klasik dengan SPSS serta Interpretasi Output
Statistika: Uji Korelasi-Regresi sederhana menggunakan SPSS

(1/4) Analisis Regresi : Uji asumsi Klasik
Uji Regresi Linear Sederhana dengan SPSS Sangat Detail

Uji Regresi Linier Sederhana Dengan SPSS | Pembahasan Lengkap!
5.0 / 5 (0 votes)