Cara Menghitung Kuartil Data Tunggal dan Data Kelompok #STATISTIKA
Summary
TLDRThis video provides a comprehensive guide on how to easily calculate quartiles (Q1, Q2, Q3) for both individual and grouped data. It starts by explaining the concept of quartiles and then walks through the step-by-step methods for calculating them in a data set. The process includes finding the positions of Q1, Q2, and Q3, determining the interquartile range, and calculating semi-interquartile range. The video also covers how to handle grouped data, including using frequency distributions and class intervals. Examples and formulas are provided to make the concepts clear and accessible.
Takeaways
- 😀 Quartiles (Q1, Q2, Q3) are used to divide data into four equal parts: lower quartile, median, and upper quartile.
- 😀 To calculate quartiles for single data, first sort the data in ascending order.
- 😀 For Q1, Q2, and Q3 in single data, use formulas involving the total number of data points (n) to find the positions of each quartile.
- 😀 The interquartile range (IQR) is calculated by subtracting Q1 from Q3, while the semi-interquartile range (SIQR) is half of the IQR.
- 😀 In single data, when calculating Q1, Q2, and Q3, use interpolation if necessary for decimal positions.
- 😀 The formula for finding Q1 in single data is Q1 = (n + 1)/4, for Q2 = 2(n + 1)/4, and for Q3 = 3(n + 1)/4.
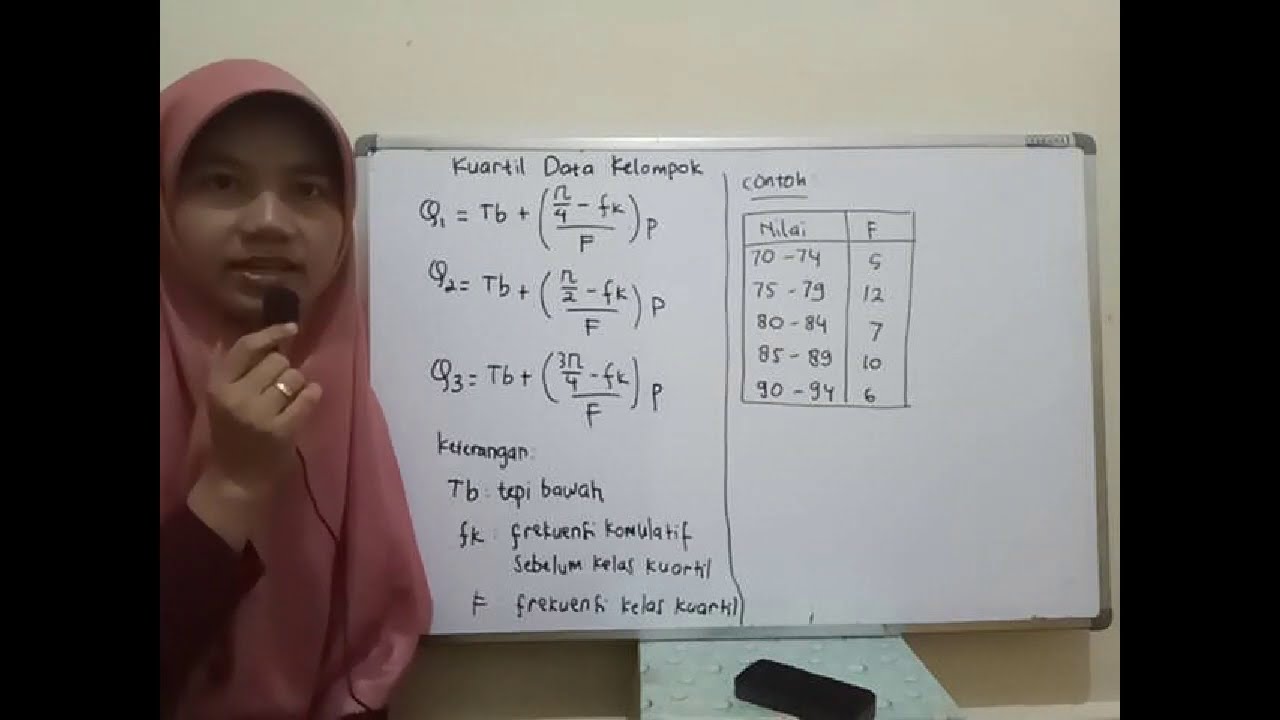
- 😀 For grouped data, quartiles are calculated using class boundaries, frequencies, and cumulative frequency.
- 😀 The formula for Q1 in grouped data is Q1 = TB + [(n/4 - ΣF) / f] * w, where TB is the lower class boundary, n is the total data points, ΣF is the cumulative frequency, f is the frequency, and w is the class width.
- 😀 To calculate Q2 for grouped data, the same approach as Q1 is used, but it represents the median or 50th percentile.
- 😀 The third quartile, Q3, is similarly calculated for grouped data, with the formula adjusting for the class containing the upper quartile position.
Q & A
What are the different types of quartiles mentioned in the script?
-The script mentions three types of quartiles: Q1 (lower quartile), Q2 (median or middle quartile), and Q3 (upper quartile). These are used to divide a data set into four equal parts.
How do you determine the position of Q1 in a data set?
-To determine the position of Q1 in a data set, use the formula: Q1 = (1/4) * (n + 1), where 'n' is the total number of data points. If the result is a decimal, interpolate between the two closest data points.
What is the method to calculate Q1 when the result is a decimal?
-When the position of Q1 results in a decimal, such as 2.75, you take the integer part (2), and the fractional part (0.75). Then, interpolate between the data points at positions 2 and 3 by adding 0.75 of the difference between the values.
What is the formula for the interquartile range (IQR)?
-The interquartile range (IQR) is calculated as IQR = Q3 - Q1, where Q3 is the upper quartile and Q1 is the lower quartile.
How is the semi-interquartile range (SIQR) calculated?
-The semi-interquartile range (SIQR) is calculated using the formula: SIQR = (Q3 - Q1) / 2. This represents half of the interquartile range.
What should you do before calculating quartiles for a data set?
-Before calculating quartiles, the data should be sorted in ascending order. Only after sorting can you correctly determine the positions of Q1, Q2, and Q3.
What is the significance of the median (Q2) in a data set?
-The median, or Q2, represents the middle value in a sorted data set. It divides the data into two equal halves, with half the data points below it and half above it.
What is the range of the data set, and how is it related to quartiles?
-The range of the data set is the difference between the largest and smallest values. The interquartile range (IQR) specifically measures the spread of the middle 50% of the data, excluding outliers.
How do you calculate quartiles for grouped data?
-For grouped data, the quartiles are calculated using a formula that involves the cumulative frequency, the class boundaries, and the frequency of the class containing the quartile. For example, Q1 is calculated by using Q1 = lower class boundary + [(n/4 - cumulative frequency of the class before Q1) / frequency of the class containing Q1] * class width.
How is the first quartile (Q1) calculated in a frequency distribution?
-To calculate Q1 in a frequency distribution, first find the cumulative frequency and the class where the 1/4th of the total frequency falls. Then apply the formula involving the lower class boundary, the cumulative frequency, and the class width.
Outlines

This section is available to paid users only. Please upgrade to access this part.
Upgrade NowMindmap

This section is available to paid users only. Please upgrade to access this part.
Upgrade NowKeywords

This section is available to paid users only. Please upgrade to access this part.
Upgrade NowHighlights

This section is available to paid users only. Please upgrade to access this part.
Upgrade NowTranscripts

This section is available to paid users only. Please upgrade to access this part.
Upgrade NowBrowse More Related Video

STATISTIKA Part 2- Jangkauan, Kuartil dan Jangkauan interkuartil

Statistika Bagian 4 - Median dan Kuartil Data Tunggal dan Data Kelompok Matematika Wajib Kelas 12

Quartil (Data Tunggal dan Kelompok)
KUARTIL DATA KELOMPOK

The Quartile for Grouped Data | Finding Q1, Q2 and Q3 | Explain in Detailed |

Kuartil Data Tunggal dan Berkelompok, matematika kelas 12
5.0 / 5 (0 votes)