Sistem Pertidaksamaan Linear Dua Variabel | Pengetahuan Kuantitatif | Alternatifa
Summary
TLDRIn this tutorial, Faisal explains how to solve systems of linear inequalities in two variables. He walks through the process of graphing these inequalities, determining intercepts, and shading the solution regions based on inequality signs. Faisal provides an example to demonstrate these steps and emphasizes the importance of understanding the graphical representation of inequalities. The video aims to help viewers visualize the solution regions and practice drawing graphs. A challenge is also provided for viewers to apply the method and submit their results for further learning.
Takeaways
- 😀 A system of linear inequalities involves multiple inequalities, each representing a relationship between two variables.
- 😀 The general form for linear inequalities in two variables is Ax + By ≤ C or similar variations, where A, B, and C are constants.
- 😀 Solving linear inequality systems involves graphing the inequalities and identifying the solution region where all inequalities overlap.
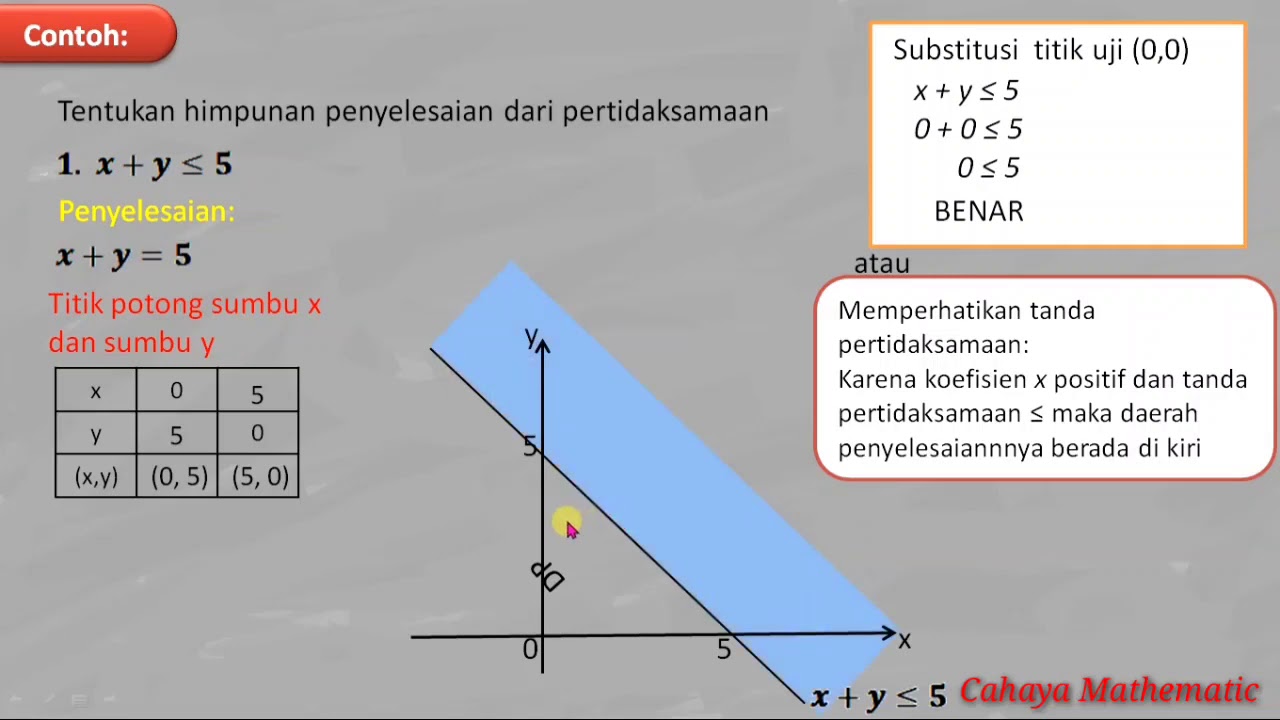
- 😀 To graph linear inequalities, first convert them into linear equations (replacing inequality signs with equality signs) to find key points.
- 😀 The solution region for a system of inequalities is determined by shading the area that satisfies all the inequalities, considering the type of inequality.
- 😀 If the inequality sign is '≤' or '≥', the solution region is above or below the line, respectively, and the line itself is included in the region.
- 😀 If the inequality sign is '<' or '>', the solution region excludes the line, and the shading is on one side of the line.
- 😀 A key step in graphing is determining where the lines intersect the axes by setting one variable to 0 and solving for the other.
- 😀 The solution region (himpunan penyelesaian or DHP) is the area that is shaded to represent all possible solutions for the system of inequalities.
- 😀 The video demonstrates with an example where multiple inequalities are plotted on a graph to show how to find the solution region.
- 😀 Faisal encourages viewers to practice by solving a challenge involving a new system of inequalities and sharing their work for review.
Q & A
What is the main topic of the video?
-The video discusses the concept of solving systems of linear inequalities with two variables, focusing on how to graph and determine the solution region for such systems.
How is the system of linear inequalities with two variables defined?
-A system of linear inequalities with two variables consists of multiple inequalities, each of which is similar to a linear equation but includes an inequality sign (e.g., ≤, ≥, <, >).
What is the general form of a linear inequality with two variables?
-The general form of a linear inequality with two variables is Ax + By ≤ C, where A and B are constants, and x and y are variables.
What is the first step in solving a system of linear inequalities?
-The first step is to convert the inequalities into equations by replacing the inequality sign with an equal sign, allowing for easier plotting on a graph.
Why is it important to find the intercepts when solving these inequalities?
-Finding the intercepts (where the line crosses the x-axis and y-axis) helps to plot the line on the graph, which is crucial for determining the solution region.
What do you need to pay attention to when shading the solution region?
-You need to pay attention to the inequality sign. For example, if the inequality is '≤', the solution region will be below the line, while for '≥', it will be above the line.
What does the shaded area on the graph represent?
-The shaded area represents the solution region, which is the set of all points that satisfy the system of inequalities.
What is the difference between the shaded and unshaded areas on the graph?
-The shaded area corresponds to the solution region, while the unshaded area represents the region that does not satisfy the inequalities.
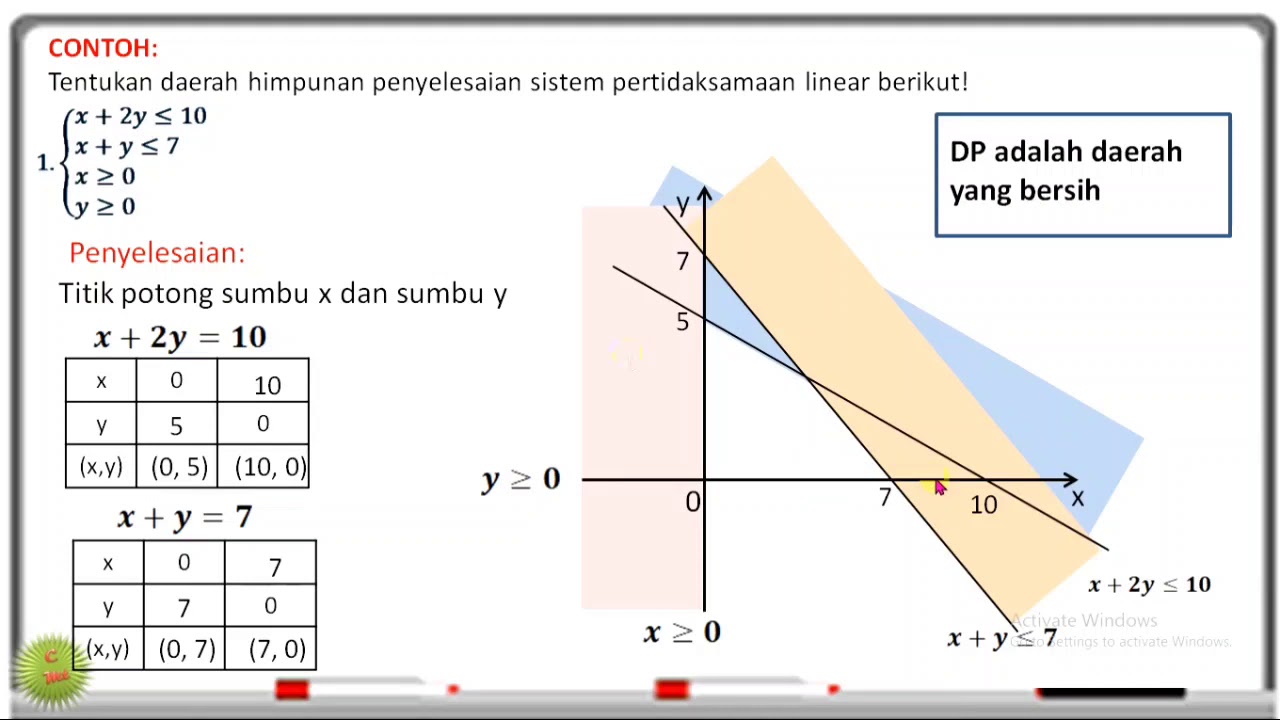
In the example provided, what are the coordinates of the intercepts for the equation x + 2y = 10?
-The intercepts are (0, 5) when x = 0 and (10, 0) when y = 0.
What challenge does Faisal give to viewers in the video?
-Faisal challenges viewers to solve a system of linear inequalities and send their solutions via WhatsApp for practice.
Outlines

This section is available to paid users only. Please upgrade to access this part.
Upgrade NowMindmap

This section is available to paid users only. Please upgrade to access this part.
Upgrade NowKeywords

This section is available to paid users only. Please upgrade to access this part.
Upgrade NowHighlights

This section is available to paid users only. Please upgrade to access this part.
Upgrade NowTranscripts

This section is available to paid users only. Please upgrade to access this part.
Upgrade NowBrowse More Related Video
SISTEM PERTIDAKSAMAAN LINEAR DUA VARIABEL SPtLDV
ILLUSTRATING LINEAR INEQUALITIES IN TWO VARIABLES || GRADE 8 MATHEMATICS Q2

Sistem Pertidaksamaan Linear Dua Variabel
PERTIDAKSAMAAN LINEAR DUA VARIABEL
SPtDV Matematika Kelas 10 • Part 1: Pertidaksamaan Linear & Kuadrat Dua Variabel
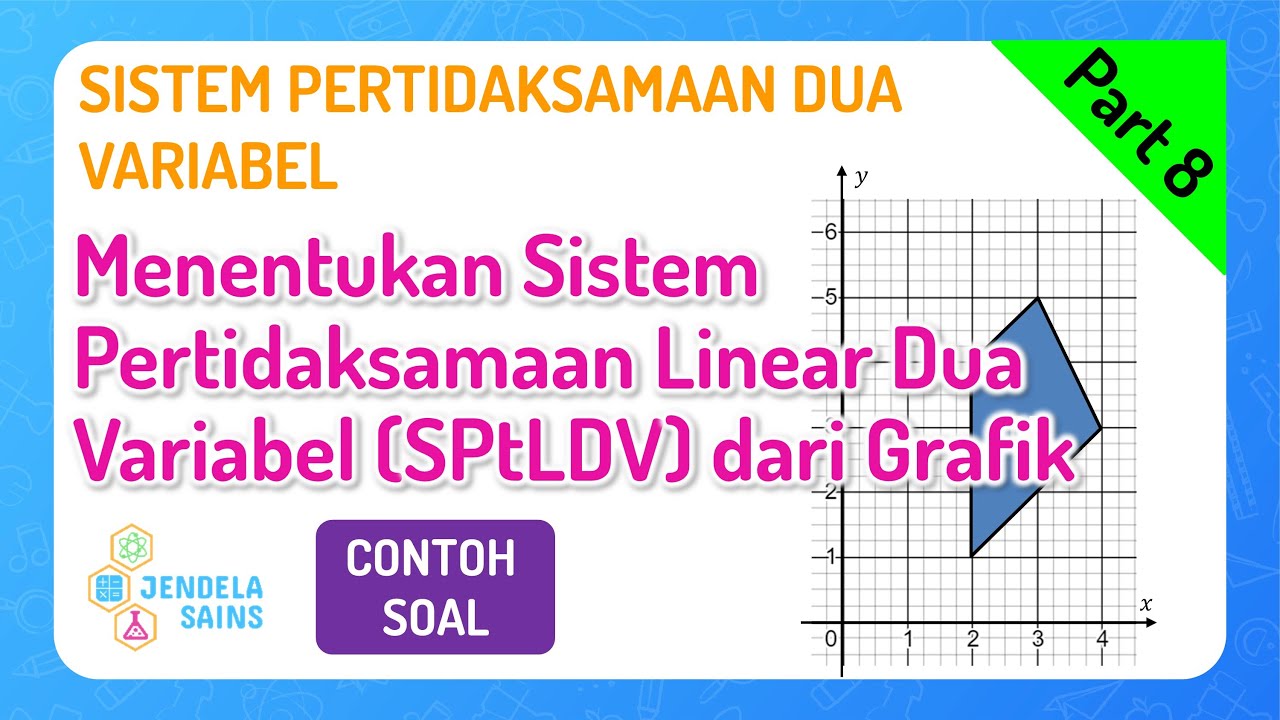
SPtDV • Part 8: Soal Menentukan Sistem Pertidaksamaan Linear Dua Variabel / SPtLDV dari Grafik (2)
5.0 / 5 (0 votes)