STATISTIKA - Cara menentukan nilai simpangan rata-rata data tunggal dan data kelompok
Summary
TLDRThis tutorial video explains how to calculate the mean deviation (simpangan rata-rata) for both single and grouped data sets. The presenter breaks down the process step by step, starting with simple calculations for a single data set, then moving to more complex grouped data with frequency tables. Viewers learn to find the mean, calculate absolute deviations, and use the formula to compute the mean deviation for both types of data. The tutorial is designed to make the process easy to understand, with clear examples and practical demonstrations.
Takeaways
- 😀 The video explains how to calculate the mean deviation for both single data and grouped data.
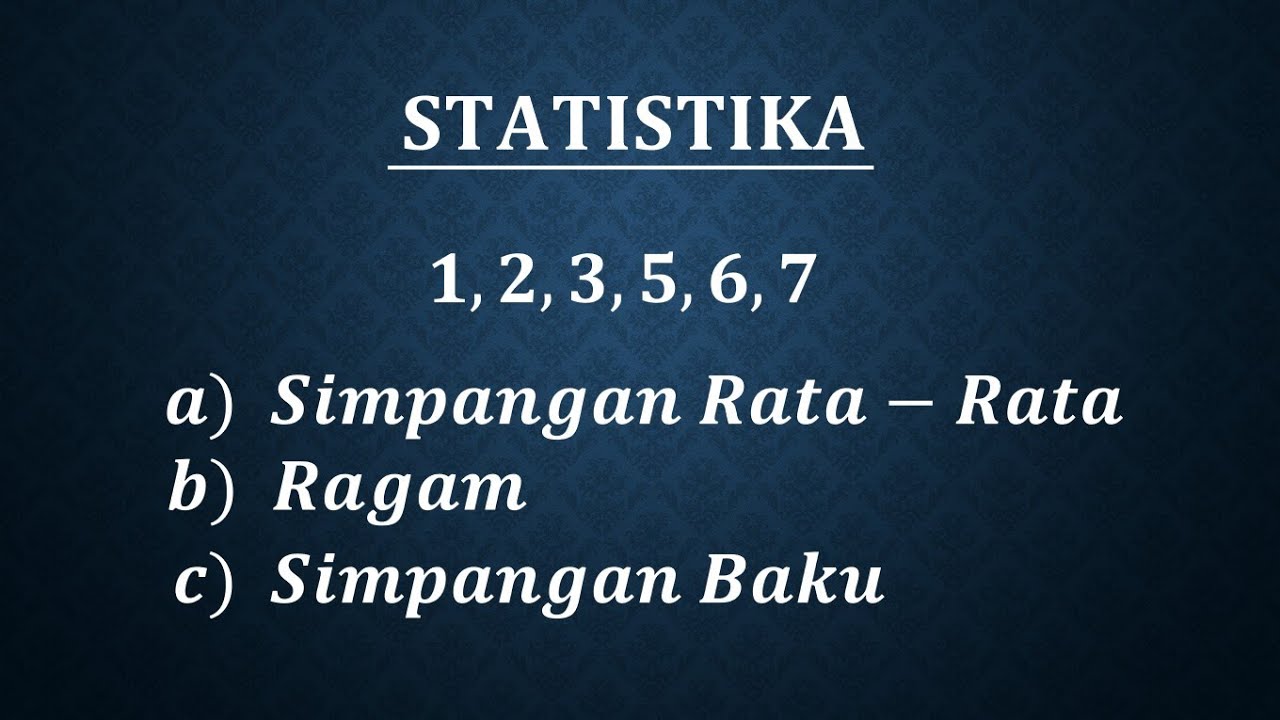
- 😀 The first part of the video focuses on calculating the mean deviation for single data, using a simple dataset: 2, 1, 4, 2, and 6.
- 😀 To find the mean, sum the data values (2 + 1 + 4 + 2 + 6 = 15) and divide by the number of data points (5), resulting in a mean of 3.
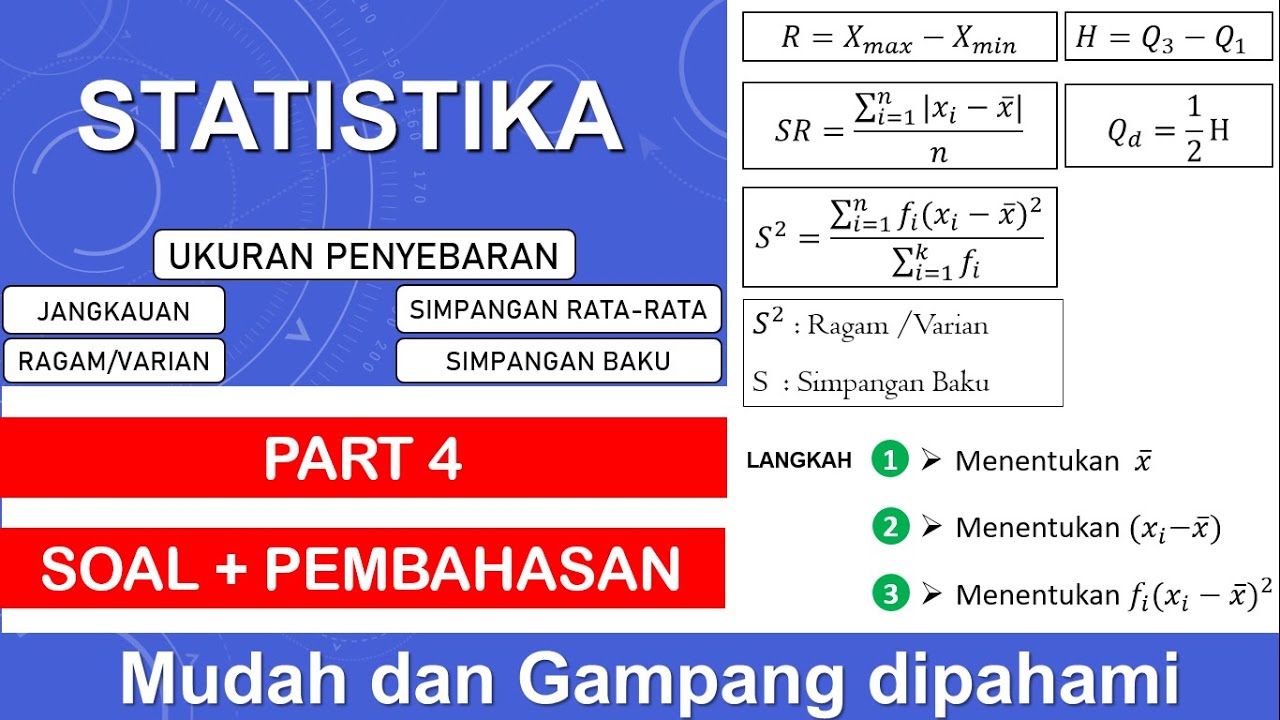
- 😀 The formula for calculating the mean deviation is SR = Σ|Xᵢ - Mean|, where Xᵢ represents the data points, and the result must be positive due to the absolute value operation.
- 😀 After calculating the mean, subtract it from each data point, take the absolute values of the results, and sum them up.
- 😀 The final mean deviation for the single data set is found by dividing the sum of absolute deviations by the number of data points, yielding a value of 1.6.
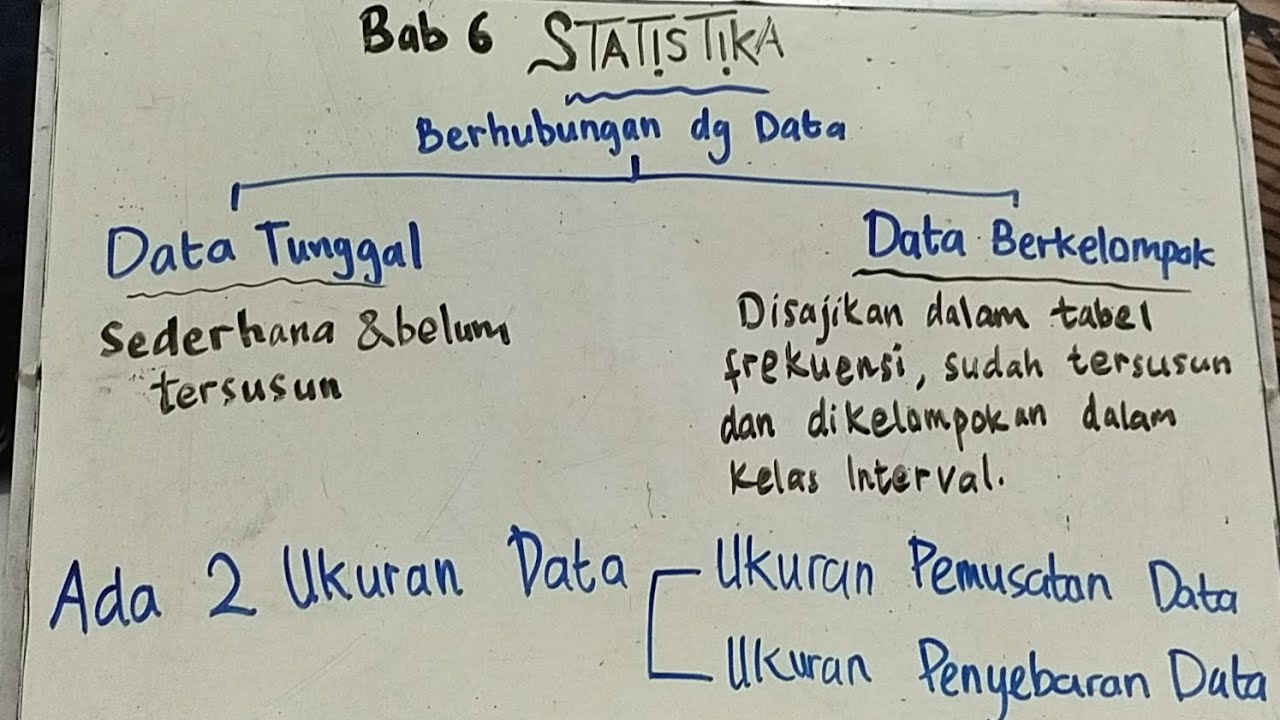
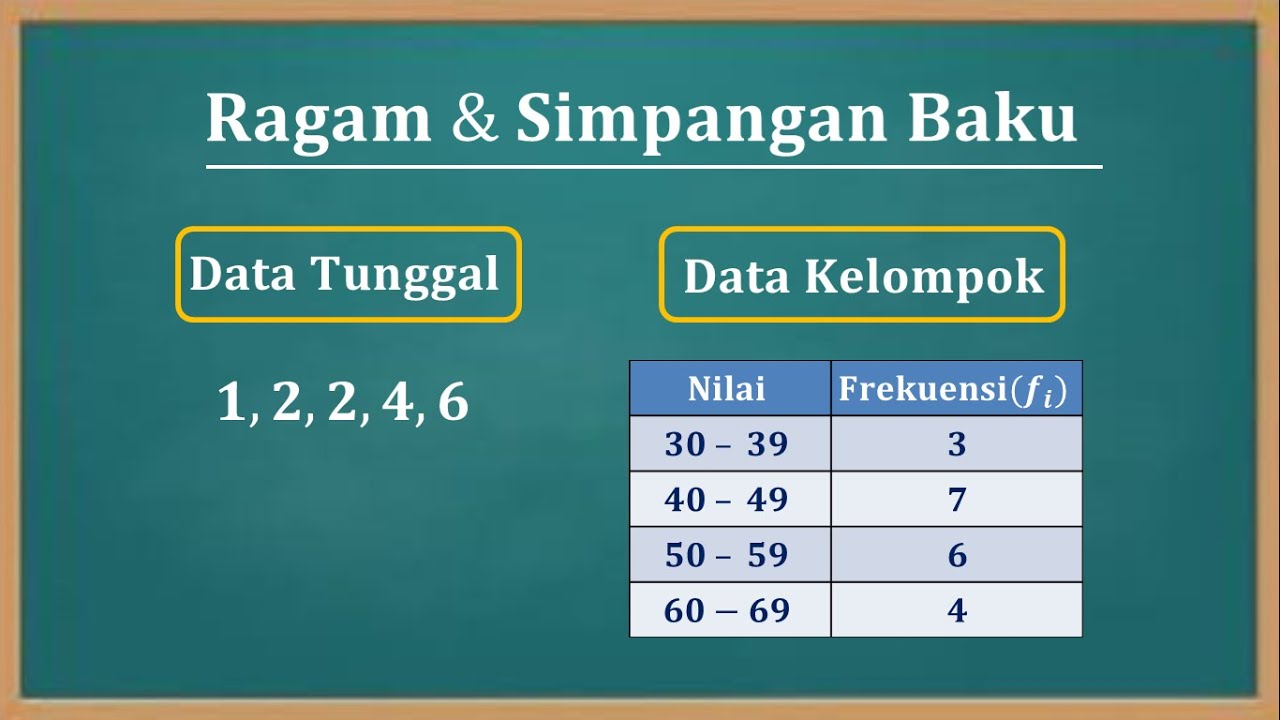
- 😀 The second part of the video shifts to calculating the mean deviation for grouped data presented in a frequency table.
- 😀 To calculate the mean deviation for grouped data, first sum the frequencies to get the total count of data points (in this case, 20).
- 😀 Next, calculate the midpoint (Xᵢ) for each data class and multiply it by the corresponding frequency to create the column 'Efi * Xᵢ'.
- 😀 The grouped data example involves using a table with midpoints and frequencies, followed by calculating the absolute deviations and multiplying by the frequencies, resulting in a sum of 170.
- 😀 The final step is to divide the sum of the weighted absolute deviations (170) by the total frequency (20) to find the mean deviation for grouped data, yielding a value of 8.5.
Q & A
What is the first step in calculating the mean deviation for a single data set?
-The first step is to calculate the mean (average) of the given data set. This is done by adding all the values and then dividing by the total number of values in the set.
How do you calculate the mean for the data set 2, 1, 4, 2, 6?
-To calculate the mean, sum the values: 2 + 1 + 4 + 2 + 6 = 15. Then divide by the number of data points (5): 15 ÷ 5 = 3. So, the mean is 3.
What does the symbol 'Sigma' (Σ) represent in the formula for mean deviation?
-In the formula for mean deviation, 'Sigma' (Σ) represents the sum of all the values calculated from the dataset. Specifically, it indicates the sum of the absolute differences between each data point and the mean.
Why is the absolute value used in the mean deviation formula?
-The absolute value is used to ensure that all differences, whether positive or negative, are treated as positive numbers. This ensures that the mean deviation represents the magnitude of the spread without regard to direction.
What is the formula for calculating the mean deviation for a single data set?
-The formula for calculating the mean deviation is: SR = Σ |X_i - mean| / n, where Σ represents the sum, X_i is each data point, mean is the average of the data, and n is the number of data points.
What are the steps for calculating the mean deviation for grouped data?
-For grouped data, the steps include: 1) Calculate the mean of the grouped data, 2) Find the midpoints (X_i) for each class interval, 3) Compute the absolute deviation for each class interval, 4) Multiply each absolute deviation by its frequency, and 5) Sum the results and divide by the total frequency.
How is the mean calculated for grouped data in the example provided?
-In the example, the midpoints of each class interval are calculated by averaging the lower and upper limits of each interval. Then, the sum of the frequencies multiplied by the midpoints is divided by the total frequency to find the mean.
What is the role of the frequency (f) in calculating the mean deviation for grouped data?
-The frequency (f) represents how many times each class interval occurs in the data. It is used to weight the contributions of each class interval when calculating the mean and the mean deviation.
How do you handle negative results in the mean deviation calculation?
-Negative results are handled using the absolute value. Any negative deviations are turned into positive values so that all deviations contribute positively to the final result.
What is the final value of the mean deviation for the grouped data in the example?
-The final value of the mean deviation for the grouped data in the example is 8.5, calculated by dividing the sum of the weighted absolute deviations (170) by the total frequency (20).
Outlines

This section is available to paid users only. Please upgrade to access this part.
Upgrade NowMindmap

This section is available to paid users only. Please upgrade to access this part.
Upgrade NowKeywords

This section is available to paid users only. Please upgrade to access this part.
Upgrade NowHighlights

This section is available to paid users only. Please upgrade to access this part.
Upgrade NowTranscripts

This section is available to paid users only. Please upgrade to access this part.
Upgrade NowBrowse More Related Video
Simpangan rata-rata, ragam dan simpangan baku data tunggal

Statistika Bagian 7 - Simpangan Baku dan Varian Data Tunggal dan Data Berkelompok
Statistika Part. 4 | Ukuran Penyebaran, Ragam, Varian, Simpangan Rata-rata, Simpangan Baku
Statistika Matematika Kelas X Kurikulum Merdeka

Statistika Dasar Ukuran Pemusatan Data (Mean, Modus, Median) Data Tunggal dan Data Kelompok
Cara menentukan nilai varian (Ragam) dan Standar deviasi (Simpangan baku) data tunggal dan kelompok
5.0 / 5 (0 votes)