Matematika SMA - Statistik Data Kelompok 1 - Membuat Tabel Distribusi Frekuensi Data Berkelompok
Summary
TLDRIn this video, the Legurless channel provides a detailed guide on how to create a frequency distribution table from group data, specifically tailored for high school students. The tutorial walks through key concepts such as class limits, class intervals, class width, and middle values. Viewers learn how to calculate the data range, determine the number of classes, and construct the table using real examples. Additional tips, including rounding class intervals, are offered for better accuracy. The video also introduces membership options on the channel and encourages viewers to subscribe and engage with the content for more educational resources.
Takeaways
- 😀 The video teaches how to create a frequency distribution table from grouped data.
- 😀 A frequency distribution table organizes data into classes or intervals with the same width.
- 😀 Class limits are essential, with a lower and upper limit for each class.
- 😀 The class edge is the value between the lower and upper limits, accounting for accuracy.
- 😀 The class length, also known as the class interval, is the difference between the upper and lower edges of a class.
- 😀 The middle value or midpoint of a class is found by averaging the lower and upper limits of that class.
- 😀 To create a frequency distribution table, you first determine the data range by identifying the smallest and largest data values.
- 😀 Sturges' formula can be used to calculate the number of classes: k = 1 + 3.3 * log(n), where n is the number of data points.
- 😀 The class interval is determined by dividing the data range by the number of classes, with rounding adjustments to ensure an odd value.
- 😀 The process includes determining class boundaries, filling the classes with data, and calculating frequencies, then ensuring the total frequency matches the data count.
Q & A
What is a frequency distribution table?
-A frequency distribution table is a way of organizing data into classes or groups, each representing a range of values. The table shows how many data points fall into each class, helping to summarize and understand large sets of data.
What are class limits in a frequency distribution table?
-Class limits refer to the lower and upper values that define the range of each class in the frequency distribution table. For example, a class might have a lower limit of 30 and an upper limit of 39.
How do class edges differ from class limits?
-Class edges are the exact boundaries of a class, adjusted for accuracy. They are typically 0.5 units less than the lower limit and 0.5 units more than the upper limit, ensuring more precise class definitions.
What is the class length (interval) in a frequency distribution table?
-The class length, also known as the class interval, is the difference between the upper and lower edges of a class. It represents the size of each class in the table and must be the same for every class.
How is the middle value (or midpoint) of a class calculated?
-The middle value or midpoint is the average of the lower and upper limits of a class. It can be calculated using the formula: (lower limit + upper limit) / 2.
What is the empirical rule of Sturges and how is it used?
-The empirical rule of Sturges is a formula used to determine the number of classes (k) for a frequency distribution table. It is given by: k = 1 + 3.3 * log(n), where n is the number of data points. This helps decide how many classes to divide the data into.
How do you determine the range of data in a frequency distribution?
-The range of data is determined by subtracting the smallest data value from the largest data value. For example, if the smallest value is 18 and the largest value is 69, the range would be 69 - 18 = 51.
What should you do after calculating the range of data?
-After calculating the range, the next step is to determine the number of classes to divide the data into. You can use Sturges' formula or manually choose the number of classes. Then, calculate the class width by dividing the range by the number of classes.
How do you create the classes for the frequency distribution table?
-To create the classes, start with the minimum data value and add the class width to it. For example, if the class width is 7, the first class could be 18-24, and the next class would start at 25. Continue adding the class width to determine each subsequent class.
What should you do once the classes are defined?
-Once the classes are defined, count how many data points fall into each class to determine the frequency for each class. This can be done by reviewing the data and checking which class each value belongs to.
Outlines

This section is available to paid users only. Please upgrade to access this part.
Upgrade NowMindmap

This section is available to paid users only. Please upgrade to access this part.
Upgrade NowKeywords

This section is available to paid users only. Please upgrade to access this part.
Upgrade NowHighlights

This section is available to paid users only. Please upgrade to access this part.
Upgrade NowTranscripts

This section is available to paid users only. Please upgrade to access this part.
Upgrade NowBrowse More Related Video
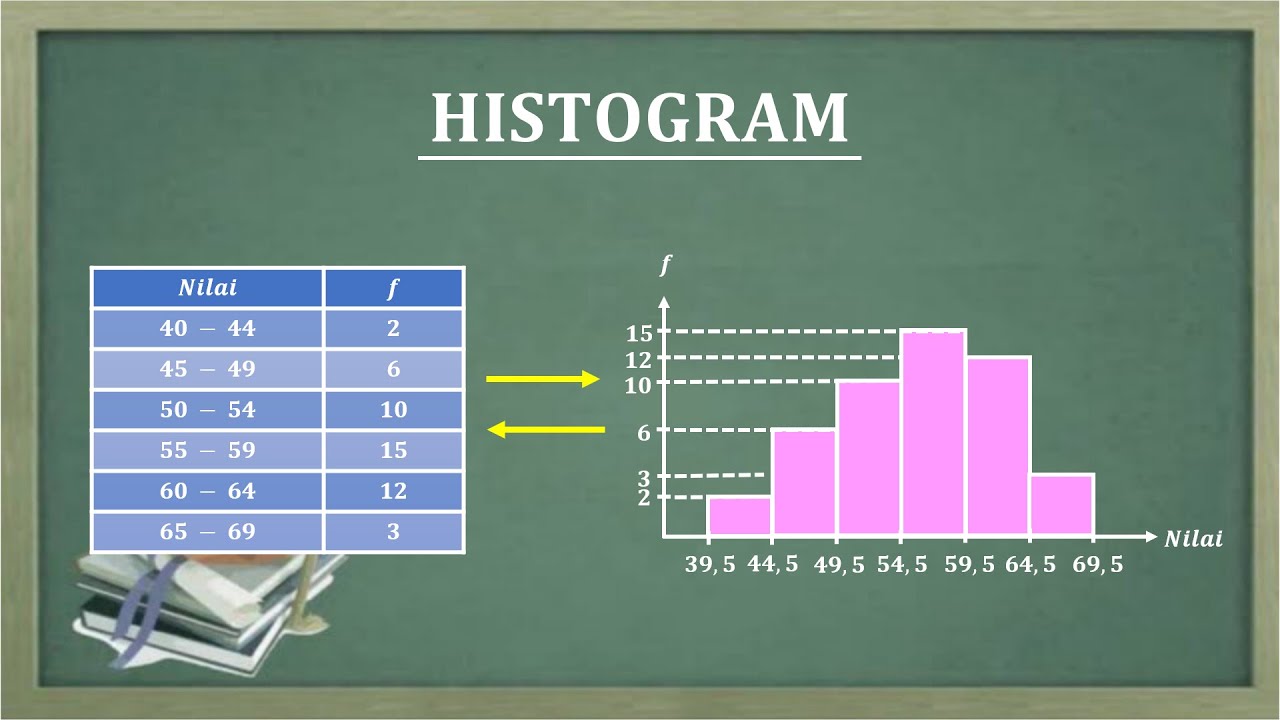
HISTOGRAM
Cara mudah menyusun tabel distribusi kelompok
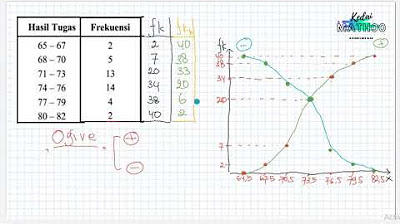
Statistika Deskriptif (Bag 1): Cara Membuat dan Membaca OGIVE

FREQUENCY DISTRIBUTION: Common Terminologies Vid#4 FREE Tutorial | Statistics | EASILY EXPLAINED!

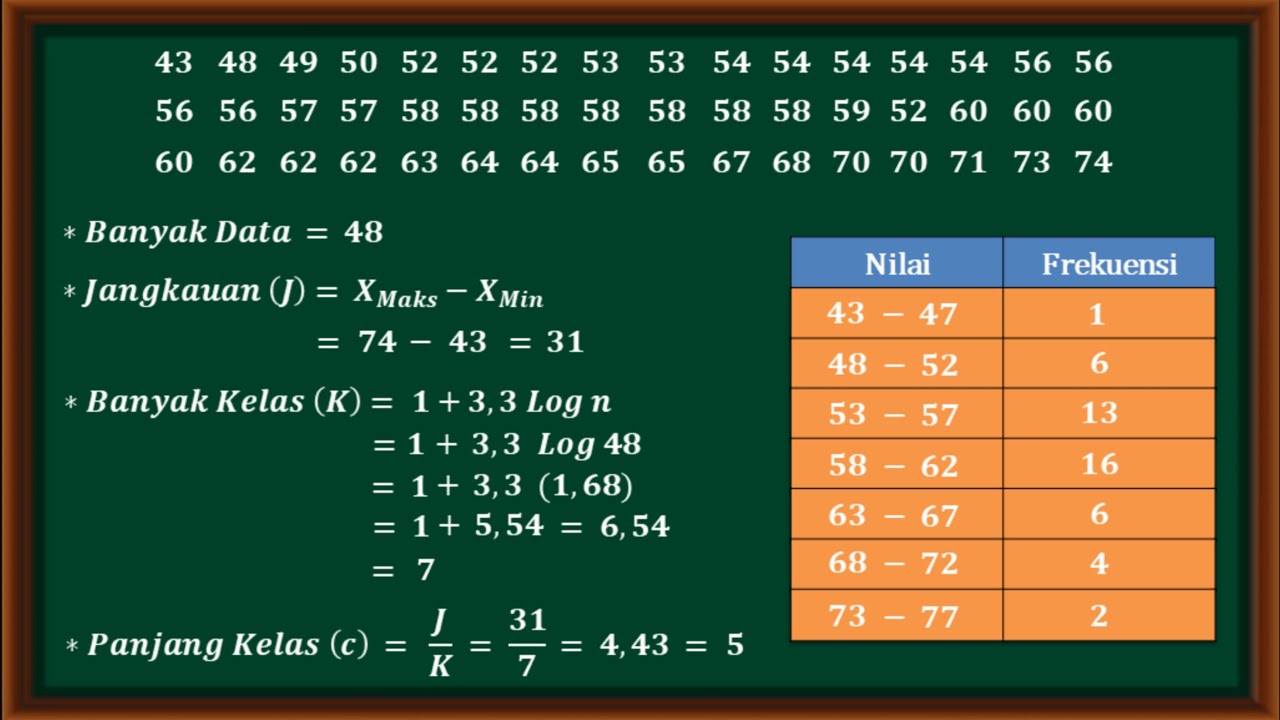
STATISTIKA : nilai jangkauan banyak kelas panjang kelas dan menyusun tabel distribusi frekuensi

Statistika (Distribusi Frekuensi Data Tunggal dan Kelompok)
5.0 / 5 (0 votes)