Statistika • Part 6: Contoh Soal Median, Kuartil, Desil, Persentil, Rataan Kuartil
Summary
TLDRIn this educational video, the host explains the concept of data centralization and demonstrates various statistical techniques used in analyzing single data sets. Key topics include median, quartiles, deciles, percentiles, and measures of central tendency like the mean and quartile averages. The host walks viewers through several examples, detailing the steps involved in calculating these statistical values using frequency tables and interpolation. The video also includes practical problem-solving techniques for finding specific data points, making it a useful guide for students learning about statistical analysis.
Takeaways
- 😀 Median is calculated using the formula Xₖ = (n + 1) / 2, where 'n' is the total number of data points, and it represents the middle value in a sorted data set.
- 😀 To calculate the first quartile (Q₁), use the formula Q₁ = Xₖ(n + 1) / 4, which corresponds to the median of the lower half of the data.
- 😀 The third quartile (Q₃) is the median of the upper half of the data, and its formula is similar to that of Q₁, but it's applied to the upper portion.
- 😀 Desiles divide data into 10 equal parts, and the second desile (D₂) is calculated using the formula D₂ = (2 * (n + 1)) / 10.
- 😀 Percentiles divide data into 100 equal parts, and the k-th percentile (Pₖ) is found using the formula Pₖ = (k * (n + 1)) / 100.
- 😀 Quartile Mean (Rataan Kuartil) is calculated as the average of the first and third quartiles (Q₁ + Q₃) / 2.
- 😀 Three Quartile Mean (Rataan Tiga Kuartil) is a weighted average of Q₁, Q₂ (median), and Q₃, calculated as (1/4)(Q₁ + 2Q₂ + Q₃).
- 😀 Linear interpolation is used when finding specific data points between two values, such as in desile and percentile calculations.
- 😀 The Five-Number Summary (Statistika Lima Serangkai) includes the minimum, Q₁, median, Q₃, and the maximum data values, providing a quick summary of the data distribution.
- 😀 For data sets with values between two specific data points (e.g., Q₁ and Q₃ or percentiles), interpolation helps estimate the value precisely.
Q & A
What is the main topic of the video?
-The main topic of the video is about measures of central tendency, specifically focusing on single data processing, including median, quartiles, deciles, percentiles, and averages.
How is the median calculated in the given example?
-To calculate the median, the formula Emi = (n + 1) / 2 is used, where n is the number of data points. In the example, with 20 data points, it is calculated as X10, which corresponds to the 10th data point.
What steps are involved in calculating quartile values?
-Quartiles are calculated by using the formula Xk = (k * (n + 1)) / 4, where k represents the quartile number (1 for the first quartile, 3 for the third quartile). The data is divided into four equal parts, and the values of the specific quartiles are identified.
How do you handle fractional positions when calculating quartiles?
-When the position falls between two data points, interpolation is used to estimate the value. For example, in the case of a fractional position like 5.25 for the first quartile, interpolation is performed between the 5th and 6th data points to find the value.
What does 'interpolation' mean in the context of this script?
-Interpolation in this context refers to estimating the value between two known data points when the calculated position of a data point is not an integer. It involves using the formula (Xk - Xlower) / (Xupper - Xlower) to find a more accurate value between two data points.
How is the percentile calculated in the example?
-Percentiles are calculated using the formula Xp = (p * (n + 1)) / 100, where p is the percentile number. For example, the 68th percentile is calculated as X14.28, which lies between the 14th and 15th data points. Interpolation is then used to determine the value.
What is the formula used to calculate the average of quartiles (mean of quartiles)?
-The formula for the mean of quartiles is (Q1 + Q3) / 2, where Q1 is the first quartile (25th percentile) and Q3 is the third quartile (75th percentile). This value gives the average of the lower and upper quartiles.
What does the 'rataan tiga kuartil' (mean of three quartiles) refer to?
-The 'rataan tiga kuartil' refers to the mean of the first, second, and third quartiles. The formula is (1/4 * Q1 + 2 * Q2 + Q3), where Q1, Q2, and Q3 represent the first, second (median), and third quartiles, respectively.
How are extreme statistics (like the minimum and maximum values) identified in the script?
-Extreme statistics, including the minimum and maximum values, are identified by looking at the first (X1) and the last (XN) data points in the ordered data set. These represent the smallest and largest values, respectively.
What is the significance of the 'statistik lima serangkai' (five-number summary)?
-The five-number summary consists of the minimum value, first quartile (Q1), median (Q2), third quartile (Q3), and maximum value. It provides a quick summary of the data distribution and is useful for understanding the spread and central tendency of the data.
Outlines

This section is available to paid users only. Please upgrade to access this part.
Upgrade NowMindmap

This section is available to paid users only. Please upgrade to access this part.
Upgrade NowKeywords

This section is available to paid users only. Please upgrade to access this part.
Upgrade NowHighlights

This section is available to paid users only. Please upgrade to access this part.
Upgrade NowTranscripts

This section is available to paid users only. Please upgrade to access this part.
Upgrade NowBrowse More Related Video

Ukuran Penyebaran Data Tunggal | Statistika Matematika Wajib Kelas 12 | Catatan Matematika @Bang-RP

Kuartil Data Tunggal dan Berkelompok, matematika kelas 12

Statistika (Distribusi Frekuensi Data Tunggal dan Kelompok)
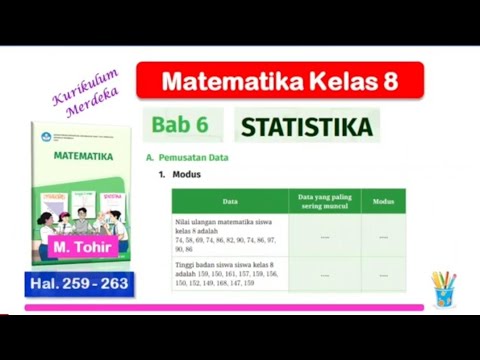
Matematika Kelas 8 Bab 6 Statisika - Modus - Hal. 259 - 263 - Kurikulum Merdeka

02 Klasifikasi data statistika
Pengertian Statistik dan Statistika, Perbedaan, dan Contohnya
5.0 / 5 (0 votes)