One Sample t-Test
Summary
TLDRThis video explains the process of performing a one-sample t-test, which is used when the population standard deviation is unknown. It follows a real-world example where a scientist tests whether a new medication affects intelligence. The video outlines the seven key steps of the t-test: defining hypotheses, setting the alpha level, calculating degrees of freedom, stating the decision rule, calculating the t-statistic, interpreting results, and drawing conclusions. The result shows that the medication significantly affects IQ, as the calculated t-statistic exceeds the critical value, leading to the rejection of the null hypothesis.
Takeaways
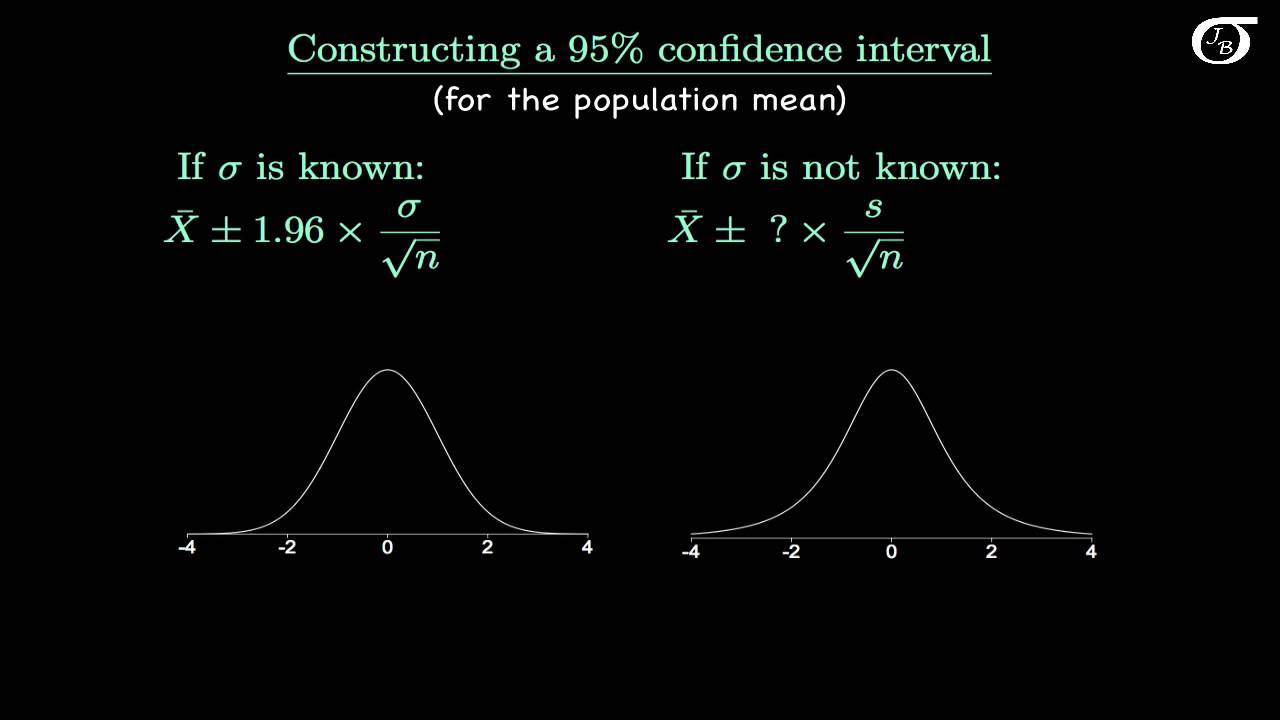
- 😀 Z-tests are used when the population standard deviation is known, while T-tests are used when the population standard deviation is unknown.
- 😀 The T-distribution is used in T-tests to account for the estimation of the population standard deviation.
- 😀 The example test involves a population mean IQ of 100 and aims to test the effect of a medication on intelligence.
- 😀 The null hypothesis (H0) assumes the sample mean IQ is equal to 100, while the alternative hypothesis (H1) assumes it is not equal to 100.
- 😀 The alpha level for the test is set at 0.05, indicating a 5% level of significance.
- 😀 Degrees of freedom for the T-test are calculated as the sample size minus 1, resulting in 29 degrees of freedom for this test.
- 😀 The decision rule is to reject the null hypothesis if the calculated T-value is outside the range of -2.04 to +2.04.
- 😀 The critical T-value for a two-tailed test with 29 degrees of freedom and an alpha level of 0.05 is 2.04.
- 😀 The calculated T-value for the sample is 10.96, which is greater than the critical value of 2.04, leading to the rejection of the null hypothesis.
- 😀 The conclusion of the test is that the medication significantly affected intelligence, as the observed sample mean differs from the expected population mean.
- 😀 The result is reported as T = 10.96 with p < 0.05, which is a formal way of presenting the findings in statistical reporting.
Q & A
What is the main difference between a Z test and a T test?
-The main difference is that Z tests are used when the population standard deviation is known, while T tests are used when the population standard deviation is unknown. The T test uses the sample standard deviation to estimate the population standard deviation.
Why do we use the T distribution when the population standard deviation is unknown?
-The T distribution is used because the sample standard deviation is an estimate of the population standard deviation. The T distribution adjusts for the increased uncertainty in this estimation, especially with smaller sample sizes.
What was the purpose of the study in the script?
-The purpose of the study was to test whether a new medication affects intelligence. The scientist wanted to see if the medication had a positive, negative, or no effect on IQ, comparing the sample mean IQ to the population mean of 100.
What were the null and alternative hypotheses in this case?
-The null hypothesis (H₀) was that the population mean IQ is 100, while the alternative hypothesis (H₁) was that the population mean IQ is not equal to 100.
What is the significance of the alpha level (α) in hypothesis testing?
-The alpha level (α) represents the probability of making a Type I error, which is rejecting the null hypothesis when it is actually true. In this case, α was set to 0.05, meaning there’s a 5% risk of concluding that the medication has an effect when it actually doesn’t.
How do you calculate degrees of freedom for a T test?
-Degrees of freedom for a T test are calculated as the sample size minus 1. In this case, with a sample size of 30, the degrees of freedom would be 30 - 1 = 29.
What does a two-tailed test mean in this context?
-A two-tailed test means that we are testing for the possibility that the sample mean could be either significantly greater than or less than the population mean. In this case, we’re testing whether the IQ could differ in either direction (higher or lower).
What is the critical value used in this test, and how is it determined?
-The critical value is 2.04, which is found using the t-distribution table for a two-tailed test with 29 degrees of freedom and an alpha level of 0.05. This critical value helps determine the rejection region for the null hypothesis.
How is the test statistic (t-value) calculated in this scenario?
-The test statistic (t-value) is calculated using the formula: t = (M - μ) / (s / √n), where M is the sample mean, μ is the population mean, s is the sample standard deviation, and n is the sample size. In this case, t = (140 - 100) / (20 / √30) = 10.96.
What does it mean when the t-statistic is greater than the critical value?
-When the t-statistic is greater than the critical value, it means that the sample mean is significantly different from the population mean. In this case, the t-statistic of 10.96 was greater than the critical value of 2.04, leading to the rejection of the null hypothesis.
Outlines

This section is available to paid users only. Please upgrade to access this part.
Upgrade NowMindmap

This section is available to paid users only. Please upgrade to access this part.
Upgrade NowKeywords

This section is available to paid users only. Please upgrade to access this part.
Upgrade NowHighlights

This section is available to paid users only. Please upgrade to access this part.
Upgrade NowTranscripts

This section is available to paid users only. Please upgrade to access this part.
Upgrade NowBrowse More Related Video

Pemilihan statistik Z atau t

t-distribution in Statistics and Probability | Statistics Tutorial #9 | MarinStatsLectures
Introduction to the t Distribution (non-technical)
Confidence Interval Concept Explained | Statistics Tutorial #7 | MarinStatsLectures

Intervalo de Confiança para a MÉDIA (μ) com variância populacional desconhecida

t-tests mini lecture
5.0 / 5 (0 votes)