Uji Komparasi One-Sample t-test
Summary
TLDRIn this tutorial, Ahmad Sodiq Pratikno walks viewers through the process of conducting a one-sample statistical test using IBM SPSS. He demonstrates how to input data, set up a test for a sample of 10 students, and compare their scores to a set benchmark (75). The tutorial covers how to execute the test, analyze the results, and interpret the significance of the findings. By the end, viewers learn how to determine if their sample significantly differs from the benchmark, offering a practical approach to one-sample hypothesis testing.
Takeaways
- 😀 The tutorial demonstrates how to conduct a one-sample statistical test using IBM SPSS.
- 😀 The test compares student test scores against a benchmark, which in this case is the Minimum Mastery Criteria (KKM) score of 75.
- 😀 To start, open IBM SPSS Statistics, and create a new data file to enter the scores of 10 students.
- 😀 After entering the data, you can label the column for clarity, for example, 'Hasil Belajar' (Test Scores).
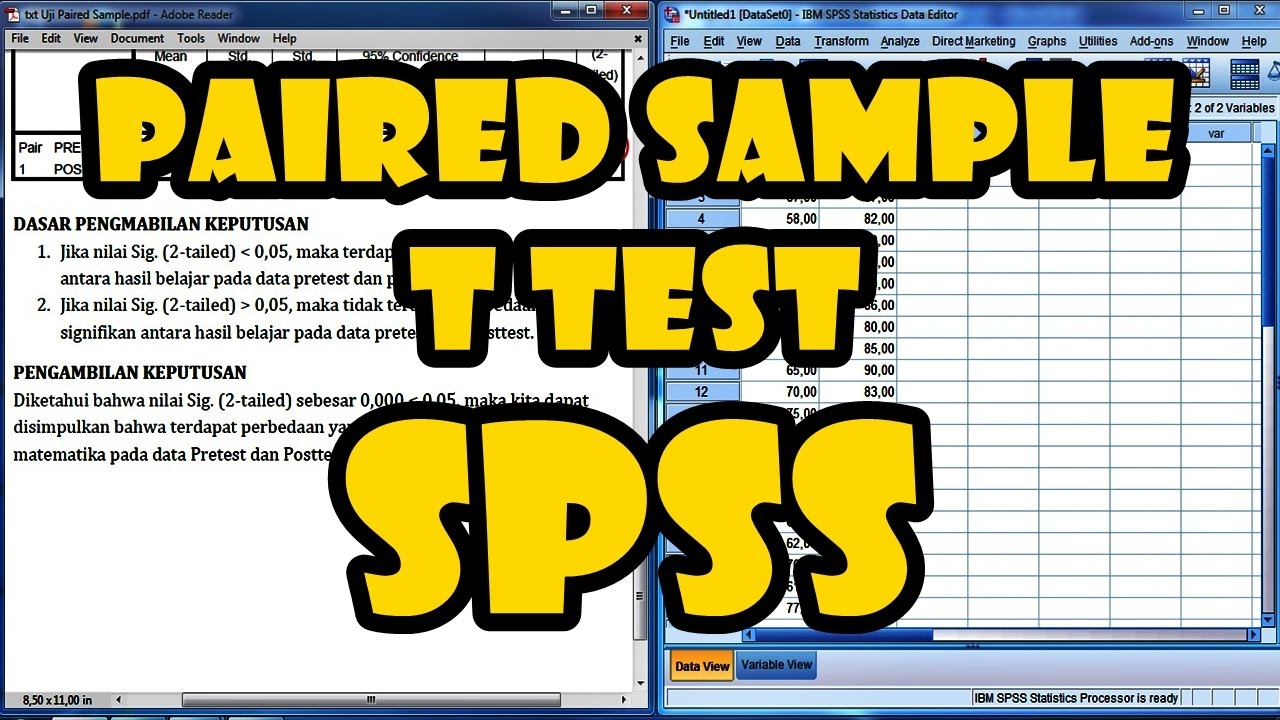
- 😀 The statistical test used is a one-sample t-test, which compares the mean of the sample data to a hypothesized population value (75 in this case).
- 😀 To run the test, select 'Analyze', then 'Compare Means', and choose 'One-Sample T Test'.
- 😀 The test value (the KKM score) is set to 75 in the 'Test Value' field during setup.
- 😀 A 95% confidence interval is used to ensure a proper level of significance for the test results.
- 😀 If the test statistic (t-value) is greater than the critical value, the difference is considered significant.
- 😀 If the p-value is less than 0.05, it indicates a statistically significant difference between the test scores and the benchmark value.
- 😀 The tutorial concludes with a suggestion to compare the test results with the benchmark to determine whether the students' performance is significantly higher than the KKM score.
Q & A
What is the focus of the video tutorial?
-The tutorial focuses on statistical testing, specifically a one-sample comparison test using IBM SPSS Statistics software.
What software is being used in this tutorial for statistical analysis?
-IBM SPSS Statistics software is used in this tutorial to perform statistical analysis.
How many students' data is being used in the example for the one-sample test?
-The tutorial uses data from 10 students for the one-sample test.
What is the range of the data values entered for the students' scores?
-The range of the data values entered is from 0 to 100.
What is the minimum passing grade (KKM) used in the analysis?
-The minimum passing grade (KKM) used in this analysis is 75.
How is the one-sample test executed in SPSS?
-To execute the one-sample test, you click on 'Analyze', then 'Compare Means', and select 'One-Sample T Test'. You then input the variable for the test and the test value (75 in this case).
What significance level is set for the test in this tutorial?
-The significance level is set to 95%, meaning the tolerance for error is 5%.
What does it mean if the test value is greater than the table value?
-If the test value is greater than the table value, it indicates a significant effect or influence between the two sets of data, meaning there is a statistical difference.
What is the key conclusion that can be drawn from the one-sample test in this tutorial?
-The conclusion is that the learning outcomes of the 10 students are above the minimum passing grade (KKM) of 75.
What should viewers do at the end of the video?
-Viewers are encouraged to like, comment, and subscribe, and to leave any questions or comments in the comment section.
Outlines

This section is available to paid users only. Please upgrade to access this part.
Upgrade NowMindmap

This section is available to paid users only. Please upgrade to access this part.
Upgrade NowKeywords

This section is available to paid users only. Please upgrade to access this part.
Upgrade NowHighlights

This section is available to paid users only. Please upgrade to access this part.
Upgrade NowTranscripts

This section is available to paid users only. Please upgrade to access this part.
Upgrade Now
5.0 / 5 (0 votes)