Cara Analisis Regresi Linear Berganda dengan Jamovi
Summary
TLDRIn this video, the presenter demonstrates how to perform multiple regression analysis using Jamovi software. The focus is on testing whether ICU, motivation, and religiosity can predict achievement. The presenter walks through the process of setting up the model, adding predictors step by step, and comparing models. The analysis shows that motivation significantly contributes to predicting achievement, while religiosity does not add a meaningful effect. The video also discusses how to interpret the regression equation, test assumptions like normality and homoscedasticity, and identify any outliers or multicollinearity in the data.
Takeaways
- 😀 The tutorial demonstrates how to perform multiple regression analysis using Jamovi software with multiple predictors.
- 😀 The analysis aims to test whether ICU, motivation, and religiosity are predictors of performance.
- 😀 The dependent variable is performance, and the predictors are ICU, motivation, and religiosity.
- 😀 Jamovi software allows for flexibility in regression analysis, including comparing models with different sets of predictors.
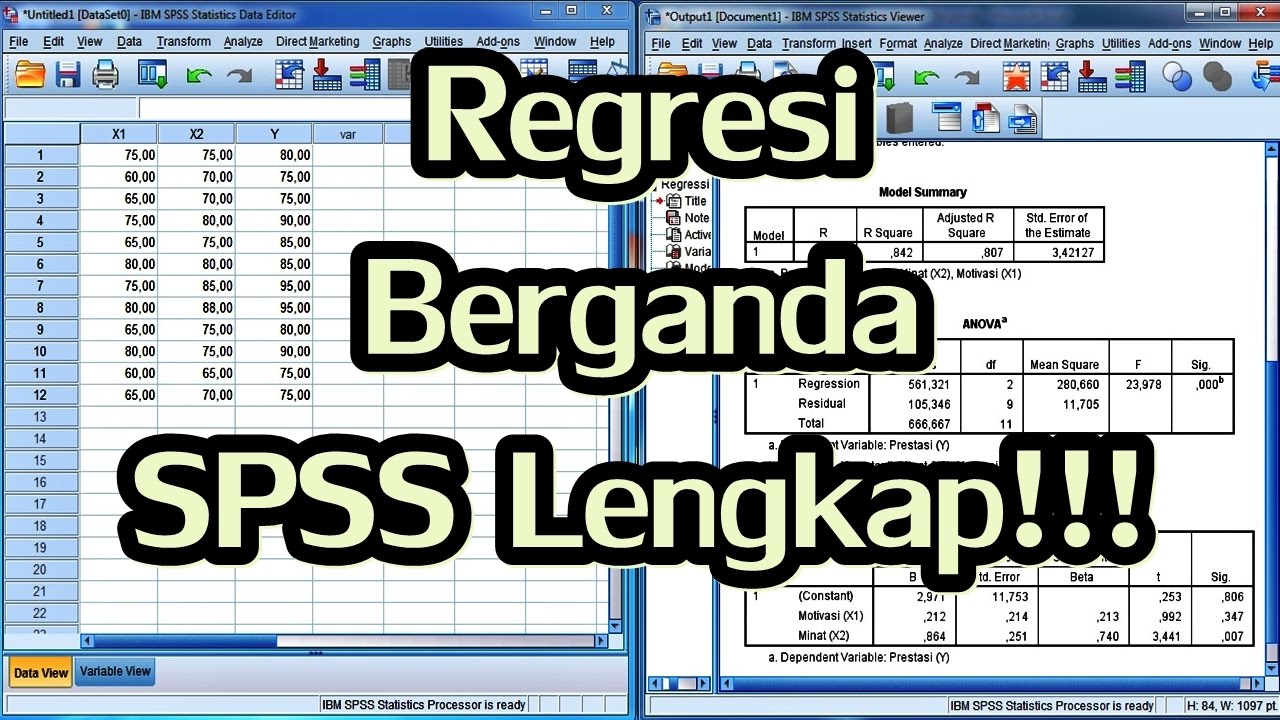
- 😀 Model 1 (ICU only) explains 33.33% of the variance in performance, and it is a significant predictor.
- 😀 Adding motivation (Model 2) increases the explained variance to 59.2%, showing a significant impact.
- 😀 Adding religiosity (Model 3) increases the explained variance slightly to 60.9%, but the change is not significant.
- 😀 A comparison of models shows that motivation significantly improves the model's predictive power, while religiosity does not.
- 😀 The regression equation for the final model includes coefficients for ICU, motivation, and religiosity, with motivation being the most influential predictor.
- 😀 Assumptions like normality, heteroscedasticity, and multicollinearity are tested and found to be met, ensuring the reliability of the model.
Q & A
What is the main purpose of this video tutorial?
-The main purpose of the video is to demonstrate how to perform multiple regression analysis using the software Jamovi, focusing on the relationship between ICU, motivation, religiosity, and achievement.
What is the dependent variable in this analysis?
-The dependent variable in this analysis is achievement, which is being predicted by ICU, motivation, and religiosity.
Why are ICU, motivation, and religiosity treated as covariates in the regression model?
-ICU, motivation, and religiosity are treated as covariates because they are continuous variables that are being tested as predictors for achievement.
What does the first model in the regression analysis represent?
-The first model in the regression analysis represents the prediction of achievement using ICU alone as the predictor.
How does the addition of motivation and religiosity impact the model?
-Adding motivation and religiosity to the model increases the explained variance in achievement, with motivation contributing significantly, while religiosity does not add a significant improvement in the model.
What was the result when comparing Model 1 and Model 2?
-The comparison showed that the addition of motivation to Model 1 explained an additional 25% of the variance in achievement, which was statistically significant.
What was the effect of adding religiosity in Model 3?
-Adding religiosity in Model 3 only explained an additional 1% of the variance, which was not statistically significant, indicating that religiosity did not have a significant impact on achievement.
How do the regression coefficients for the predictors relate to achievement?
-The regression coefficients indicate the strength and direction of each predictor's relationship with achievement. ICU and motivation have significant positive relationships, while religiosity has no significant effect on achievement.
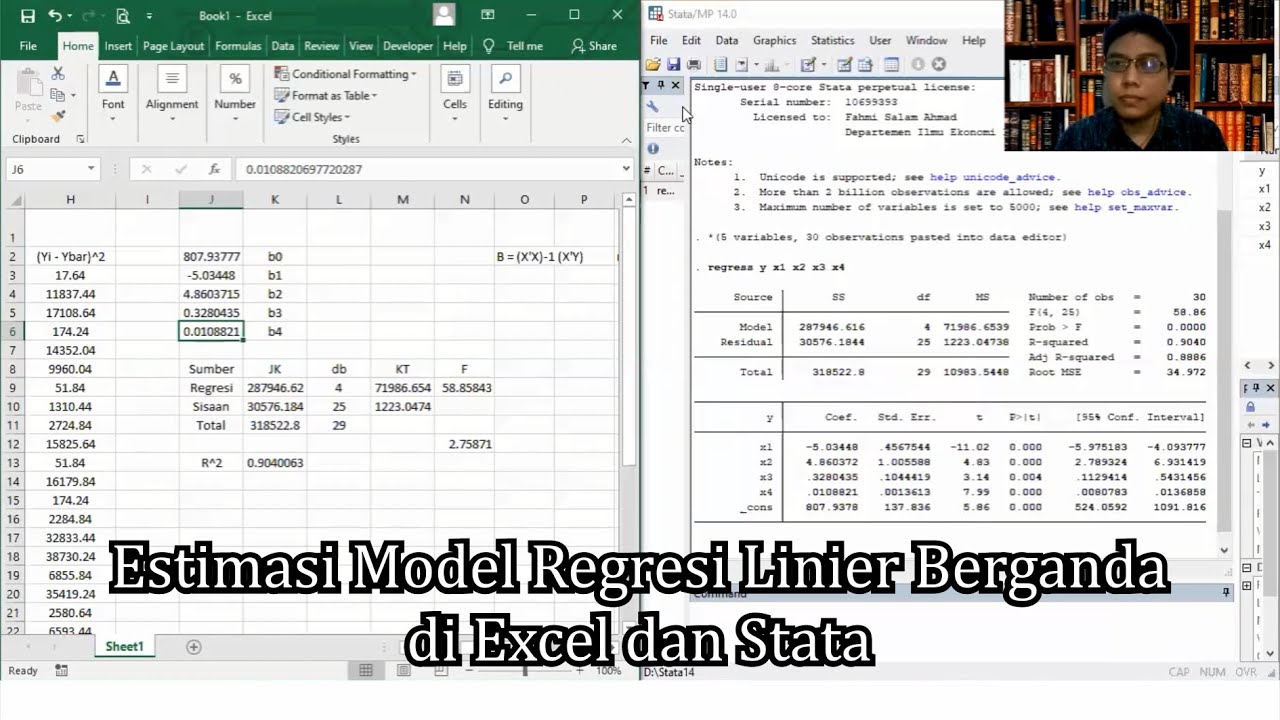
What does the unstandardized regression equation show?
-The unstandardized regression equation provides the specific values for the predictors that can be used to calculate predicted achievement based on the values of ICU, motivation, and religiosity.
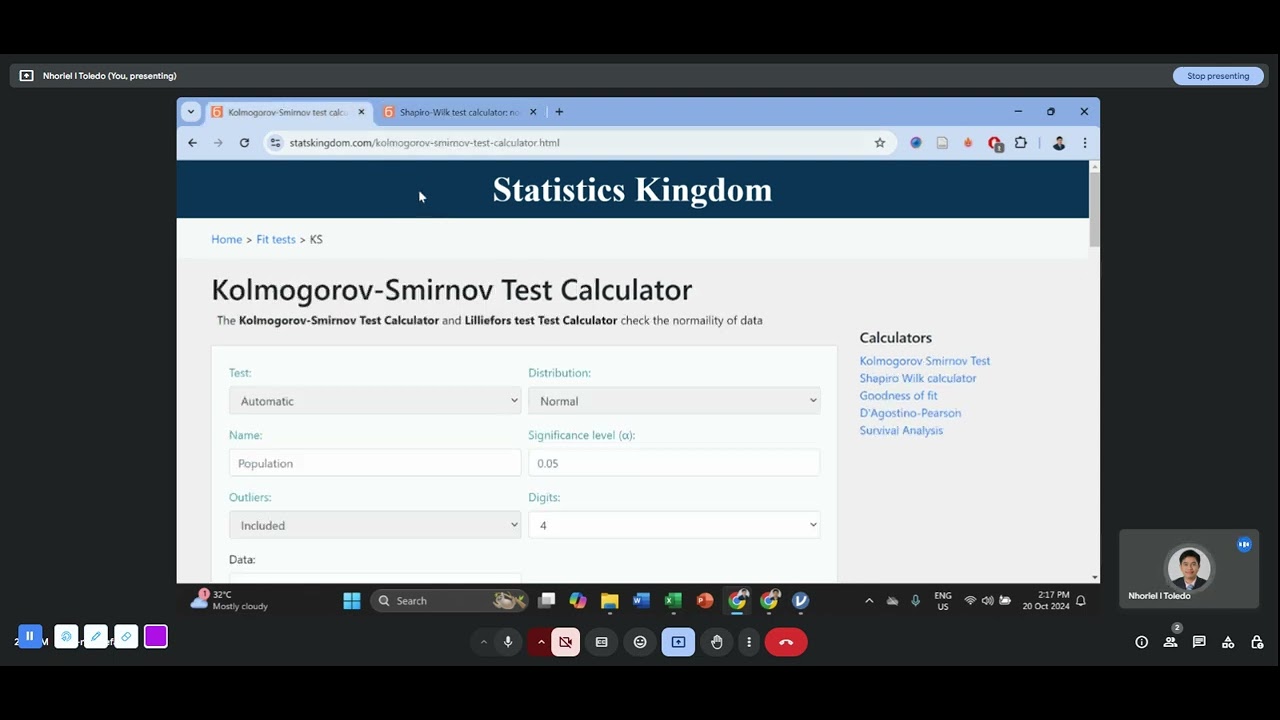
What steps are taken to check for data issues like outliers or normality?
-The analysis checks for outliers by examining the range and maximum values, uses normality tests like Shapiro-Wilk and Kolmogorov-Smirnov, and checks for homoscedasticity and multicollinearity among the predictors.
Outlines

This section is available to paid users only. Please upgrade to access this part.
Upgrade NowMindmap

This section is available to paid users only. Please upgrade to access this part.
Upgrade NowKeywords

This section is available to paid users only. Please upgrade to access this part.
Upgrade NowHighlights

This section is available to paid users only. Please upgrade to access this part.
Upgrade NowTranscripts

This section is available to paid users only. Please upgrade to access this part.
Upgrade NowBrowse More Related Video

Aplikasi Model Regresi dan Pengembangan

Cara Menghitung Analisis Regresi Sederhana secara Manual
Cara Analisis Regresi Berganda dengan JASP
Uji t dan Uji F dalam Analisis Regresi Berganda dengan SPSS Lengkap
Praktikum Ekonometrika I P4 - Regresi Linier Berganda
Biostatistics & Epidemiology - Use of Excel and Jamovi on Correlation Analysis
5.0 / 5 (0 votes)