Testing For Normality - Clearly Explained
Summary
TLDRThis video explains how to assess whether data is sampled from a normal distribution, a key assumption in parametric statistical tests like t-tests and ANOVA. It covers two main methods: graphical analysis, including frequency distributions and QQ plots, and statistical normality tests like the D'Agostino Pearson, Shapiro Wilk, and Kolmogorov-Smirnov tests. The video emphasizes the importance of not relying solely on p-values and suggests combining graphical and statistical methods to draw conclusions about normality, especially considering sample size effects on test power.
Takeaways
- 😀 Normality testing is crucial for parametric statistical tests like t-tests and ANOVA to ensure data is sampled from a normal distribution.
- 😀 Two common ways to assess normality are graphical analysis (e.g., QQ plots, frequency distributions) and normality tests (e.g., Shapiro-Wilk, D'Agostino Pearson, Kolmogorov-Smirnov).
- 😀 Graphical methods like frequency distributions can help identify if data forms a bell-shaped curve, indicating normality.
- 😀 It can be difficult to visually assess normality in small samples, but as the sample size increases, this becomes easier.
- 😀 QQ plots plot observed data against expected values from a normal distribution. Deviations from the diagonal line indicate skewed data.
- 😀 Normality tests use p-values to test whether sample data comes from a normal distribution. A p-value greater than 0.05 suggests normality, while a p-value less than 0.05 suggests non-normality.
- 😀 The null hypothesis for normality tests assumes the data comes from a normal distribution, while the alternative hypothesis suggests otherwise.
- 😀 The interpretation of normality test results involves comparing the p-value to a significance threshold (commonly 0.05) to either accept or reject the null hypothesis.
- 😀 The sample size can significantly impact the outcome of normality tests—small samples have less power to reject the null hypothesis, and large samples might detect minor deviations.
- 😀 It is recommended to combine multiple methods for assessing normality, such as performing a normality test and visualizing the data with QQ plots and frequency distributions, for a comprehensive analysis.
Q & A
Why is normality testing important in statistical analysis?
-Normality testing is important because many parametric statistical tests, such as t-tests and ANOVA, assume that data is sampled from a normal distribution. Testing for normality ensures the validity of these tests and their results.
What are the two main approaches to testing normality?
-The two main approaches to testing normality are graphical analysis (such as frequency distributions and QQ plots) and normality tests (like the D'Agostino Pearson omnibus test, the Shapiro-Wilk test, and the Kolmogorov-Smirnov test).
What is the purpose of graphical analysis in normality testing?
-Graphical analysis, such as frequency distributions, QQ plots, and box plots, helps visually assess if the data follows a normal distribution. These methods allow for a clear representation of the data’s distribution, which can indicate normality or deviations from it.
How can frequency distributions be used to test for normality?
-Frequency distributions categorize data into bins and plot the relative frequency. If the data forms a bell-shaped curve, it suggests the data is normally distributed. However, this is easier to see with larger sample sizes and may be difficult with smaller samples.
What are QQ plots and how do they help in testing normality?
-A QQ plot compares the quantiles of the sample data to the quantiles expected from a normal distribution. If the points lie on or close to the diagonal line, the data is likely normal. Deviations from the line, especially at the ends, suggest skewness or other departures from normality.
What is the role of normality tests in statistical analysis?
-Normality tests are statistical methods used to determine if a dataset deviates from a normal distribution. These tests provide a p-value that helps decide if the data is likely to have come from a normal population.
What is the null hypothesis in normality testing?
-The null hypothesis in normality testing states that the sample data is sampled from a population that follows a normal (Gaussian) distribution. The alternative hypothesis is that the sample data does not come from a normal distribution.
How do you interpret the p-value from a normality test?
-If the p-value is greater than 0.05, you fail to reject the null hypothesis, suggesting the data is consistent with a normal distribution. If the p-value is less than or equal to 0.05, you reject the null hypothesis and conclude that the data is not normally distributed.
How does sample size affect normality tests?
-Small sample sizes may not have enough power to reject the null hypothesis, while large sample sizes may detect even minor deviations from normality. It's important to consider both the test results and graphical methods when testing normality.
What is the recommended approach when testing for normality?
-It’s recommended to perform a single normality test and not multiple tests. In addition, graphical analysis (such as examining QQ plots and frequency distributions) should be used to complement the normality test. This combined approach provides a more reliable assessment of normality.
Outlines

This section is available to paid users only. Please upgrade to access this part.
Upgrade NowMindmap

This section is available to paid users only. Please upgrade to access this part.
Upgrade NowKeywords

This section is available to paid users only. Please upgrade to access this part.
Upgrade NowHighlights

This section is available to paid users only. Please upgrade to access this part.
Upgrade NowTranscripts

This section is available to paid users only. Please upgrade to access this part.
Upgrade NowBrowse More Related Video
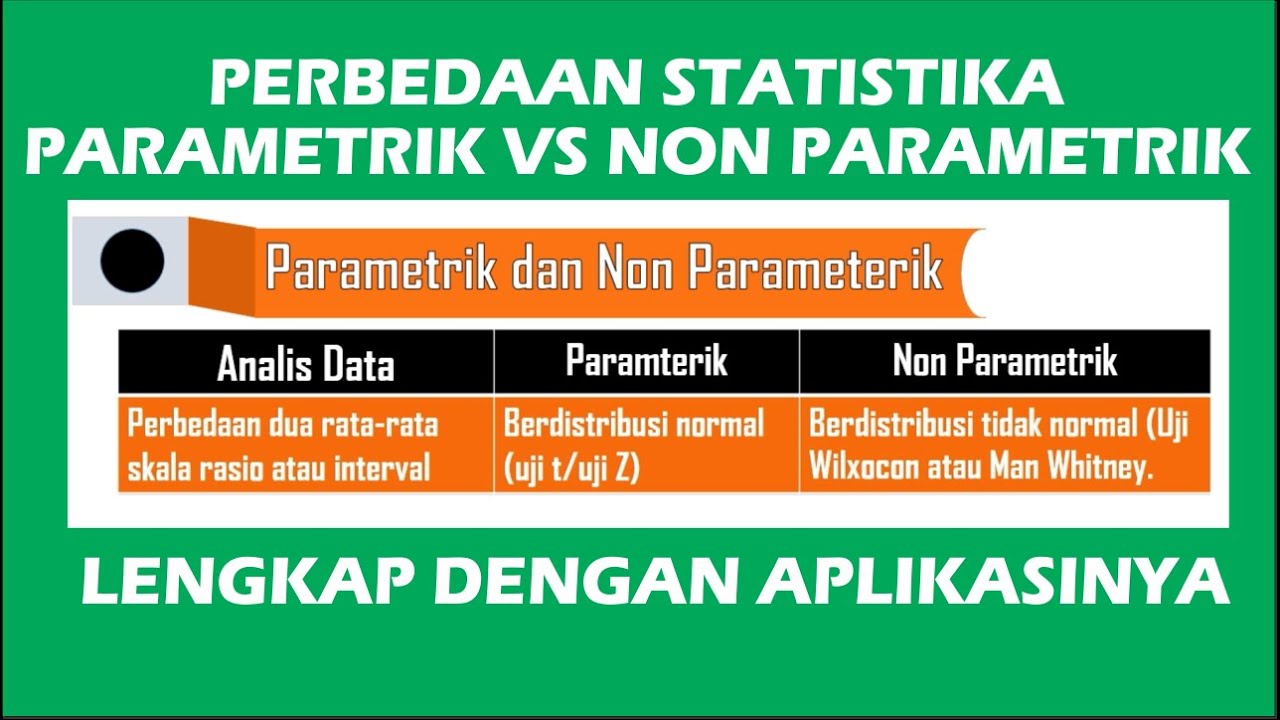
Perbedaan Statistika Parametrik dan Non Parametrik

KONSEP DASAR UJI BEDA MEAN | BERPASANGAN VS TIDAK BERPASANGAN ❓❓❓❓

#2- UJI NORMALITAS DATA KELAS EKSPERIMEN DAN KELAS KONTROL MENGGUNAKAN SPSS

Parametric and Nonparametric Tests

27. Normality Testing of the Data in IBM SPSS || Dr. Dhaval Maheta

Common Statistical Tools: Preliminary Concepts
5.0 / 5 (0 votes)