Natural Cubic Spline Interpolation Example | Numerical Methods
Summary
TLDRIn this video, the presenter walks through a natural cubic spline interpolation example, explaining how to approximate a smooth curve through a set of data points. The video covers the theory behind cubic spline interpolation, shows the step-by-step process to find the necessary equations, and uses a Gauss elimination solver to calculate the coefficients of the interpolating polynomials. After solving the equations, the presenter visualizes the polynomials and evaluates them at specific points. The video is a helpful guide for understanding and solving cubic spline interpolation problems.
Takeaways
- 😀 Cubic spline interpolation is a mathematical method used to approximate a smooth curve through a set of data points.
- 😀 It is especially useful when you have scattered data points and want to create a continuous curve that captures a general trend.
- 😀 In this example, the data represents the growth of a plant over time, and the goal is to interpolate a smooth curve through the points.
- 😀 For four data points, we will have three cubic splines to fit, and each spline requires solving for 4 unknown coefficients.
- 😀 The system of equations to solve for the coefficients is created by evaluating the cubic polynomials at known data points.
- 😀 To ensure smoothness, the first and second derivatives of the polynomials at interior data points are matched.
- 😀 The second derivatives at the endpoints of the spline are assumed to be zero, as this represents a natural cubic spline.
- 😀 After deriving the equations, you need to solve for the 12 unknowns, which can be done through solving a system of linear equations.
- 😀 Gauss elimination with partial pivoting is used to solve the linear system of equations in this example.
- 😀 Once the coefficients are found, the polynomials are visualized, and specific input values (1.5, 4, and 7) are evaluated to obtain the interpolated values.
Q & A
What is cubic spline interpolation?
-Cubic spline interpolation is a mathematical technique used to approximate a smooth curve passing through a set of data points. It is particularly useful when we have scattered data points and need a continuous curve that captures the general trend of the data.
Why is cubic spline interpolation useful?
-Cubic spline interpolation is useful because it allows us to create a smooth curve that approximates the behavior of a set of scattered data points. It provides a continuous and differentiable curve, which helps in understanding the underlying trend of the data.
How many splines are used when interpolating a set of four data points?
-When interpolating a set of four data points, we use three splines. This is because the number of splines is always one less than the number of data points.
What is the goal when performing cubic spline interpolation in this example?
-The goal in this example is to interpolate a smooth curve that accurately represents the growth pattern of a plant over time, based on four given data points.
How do we derive the equations needed to solve for the coefficients of the splines?
-We derive the equations by evaluating each polynomial function at the known data points, ensuring smoothness of the first and second derivatives at the interior points, and applying the natural cubic spline condition that the second derivative at the endpoints is zero.
What does 'natural cubic spline' refer to in this context?
-A natural cubic spline refers to a cubic spline interpolation where the second derivatives of the polynomial at the endpoints are assumed to be zero, meaning the curve is flat at both ends.
Why do we have 12 equations to solve in this problem?
-We have 12 equations because there are 3 splines to fit, and each spline has 4 unknown coefficients. This results in a total of 12 unknowns and, therefore, 12 equations to solve.
What method is used to solve the system of linear equations in this problem?
-The system of linear equations is solved using the Gauss elimination method with partial pivoting, a numerical method that helps solve systems of linear equations efficiently.
How are the interpolating polynomials visualized after solving for the coefficients?
-The interpolating polynomials are visualized by plotting them in Microsoft Excel, keeping track of their domains and ensuring they match the given data points and the resulting smooth curve.
How are the values of the interpolating polynomials evaluated at specific points?
-To evaluate the interpolating polynomials at specific points, we use the polynomial corresponding to the domain in which the input lies. For example, for an input of 1.5, the first polynomial is used, and similar steps are followed for other input values like 4 and 7.
Outlines

This section is available to paid users only. Please upgrade to access this part.
Upgrade NowMindmap

This section is available to paid users only. Please upgrade to access this part.
Upgrade NowKeywords

This section is available to paid users only. Please upgrade to access this part.
Upgrade NowHighlights

This section is available to paid users only. Please upgrade to access this part.
Upgrade NowTranscripts

This section is available to paid users only. Please upgrade to access this part.
Upgrade NowBrowse More Related Video

Chapter 8: Piecewise Interpolation (Part 1 - Introduction)
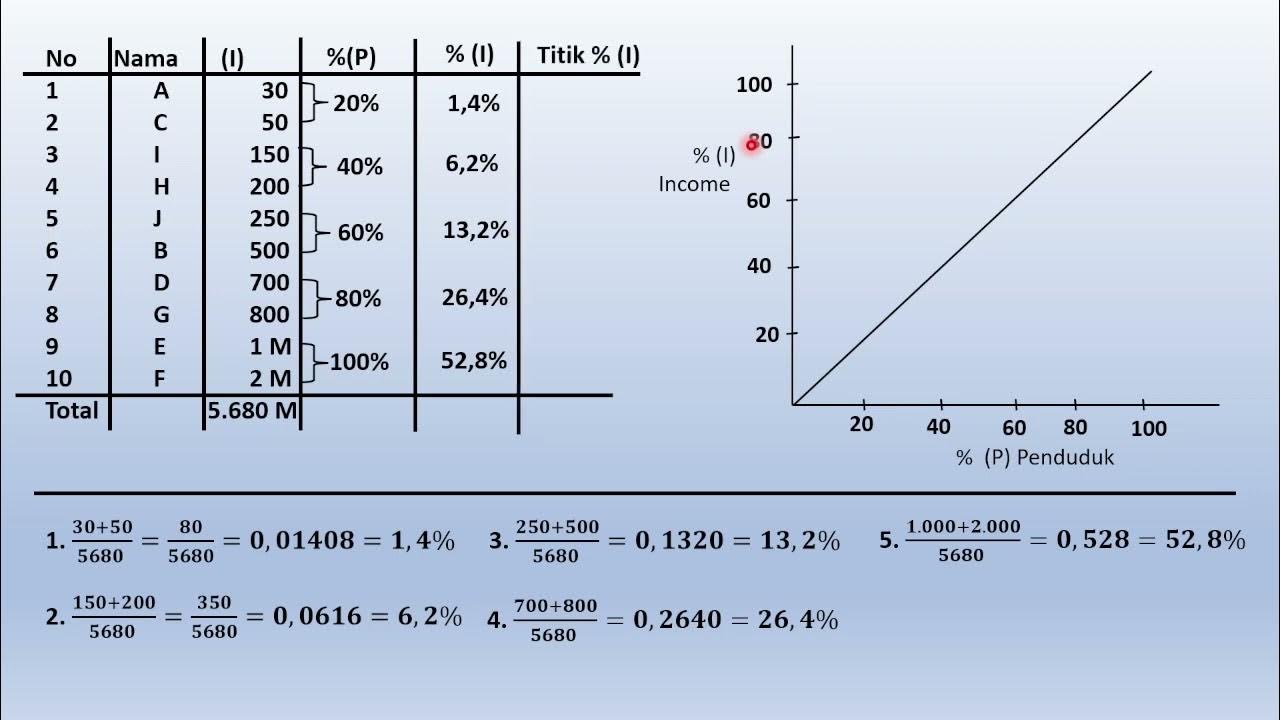
Kurva Lorenz #2

Interpolasi linier || tonton sampai habis agar paham
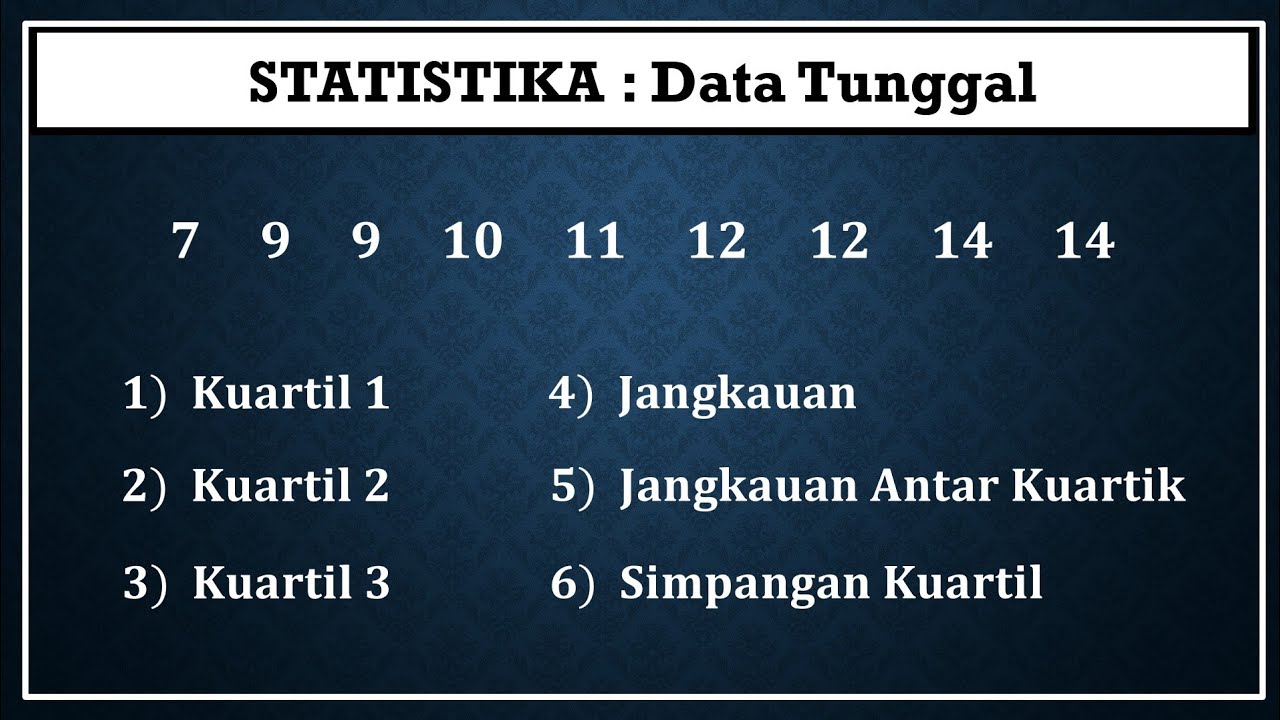
STATISTIKA - Kuartil, Jangkauan, Jangkauan Antar Kuartil Dan Simpangan Kuartil Data Tunggal

Joining two functions so that their gradients match: Part 1 (Maths Methods PSMT IA1 prep)

Spline Cubic
5.0 / 5 (0 votes)