MATERI UTBK SNBT PENALARAN MATEMATIKA - STATISTIKA
Summary
TLDRIn this educational video, tutor Kak Yuni explains various statistical concepts like averages, modes, medians, ranges, and quartiles, both for individual and grouped data. The video walks through formulas and provides step-by-step problem-solving for real-life scenarios, such as calculating the average score of students and determining the impact of remedial exams. The tutorial includes examples of how to calculate statistical measures, with a focus on understanding how to interpret and manipulate data for better decision-making in math and statistics.
Takeaways
- 😀 The video discusses statistics, dividing it into two categories: single data and grouped data.
- 😀 The formula for calculating the mean (average) of single data is explained as: x̄ = (X₁ + X₂ + ... + Xn) / n.
- 😀 Mode is defined as the data point that appears most frequently in a dataset.
- 😀 Median is the middle value in a dataset. The formula differs for odd and even data sets.
- 😀 Range (jangkauan) is the difference between the maximum and minimum values in the data.
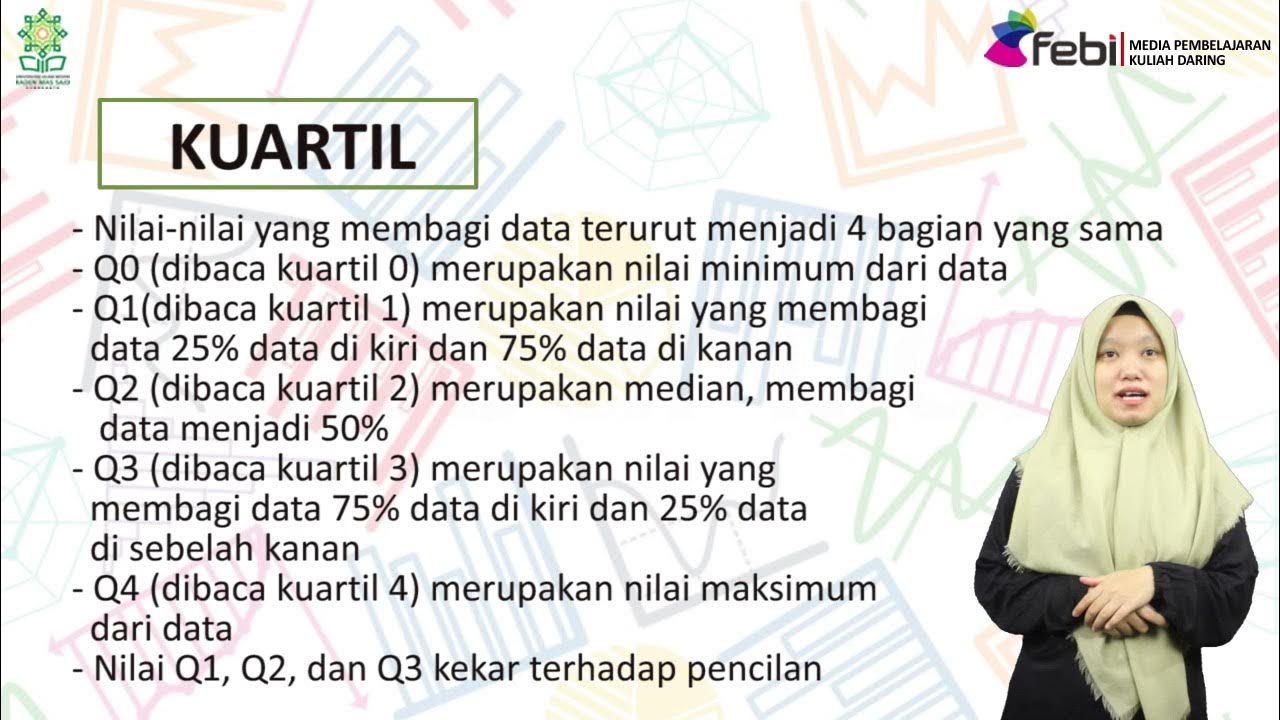
- 😀 Quartiles divide a dataset into four equal parts, with Q1, Q2 (the median), and Q3 being the key points.
- 😀 The formula for calculating the interquartile range (QR) is: QR = (Q3 - Q1) / 2.
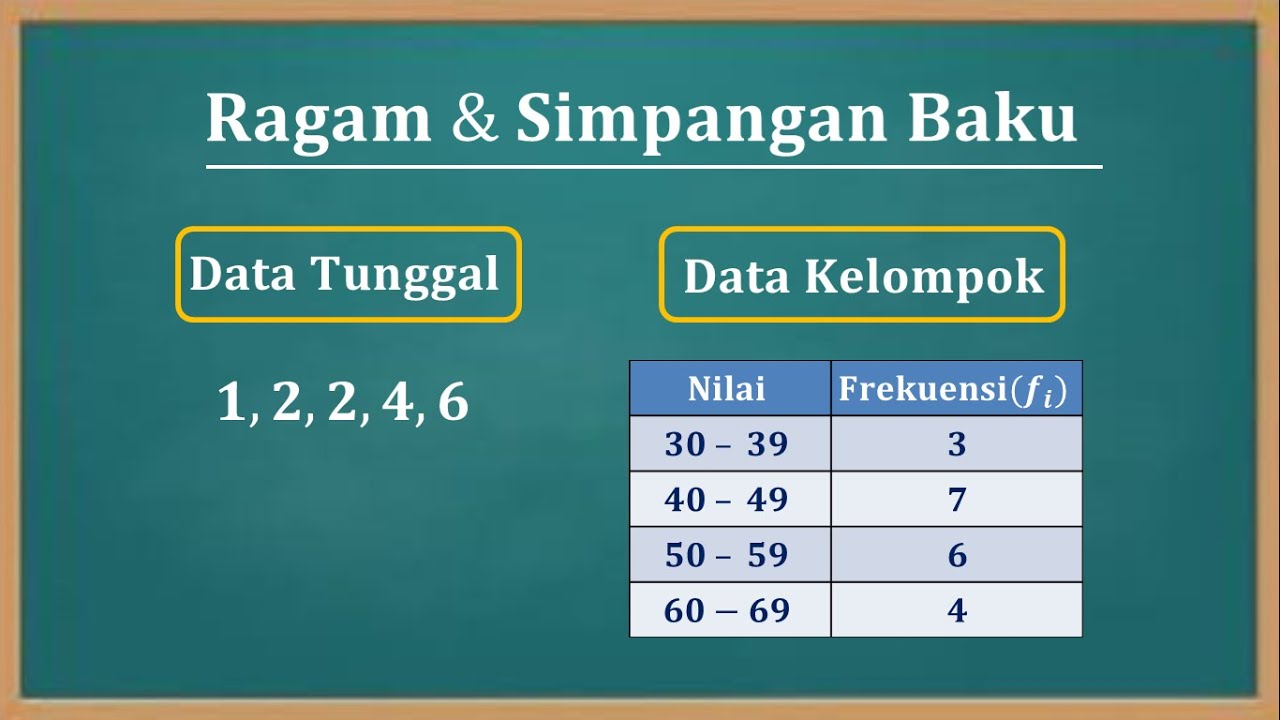
- 😀 Standard deviation and variance measure the spread of data. Standard deviation is the square root of variance.
- 😀 For grouped data, the mean is calculated using the weighted sum of the data and its frequencies: x̄ = (F₁ * X₁ + F₂ * X₂ + ... + Fi * Xi) / (F₁ + F₂ + ... + Fi).
- 😀 The concept of the combined average (gabungan) is explained, where the average of two groups can be calculated using their individual averages and frequencies.
- 😀 A practical example is provided about calculating the average and minimum scores of students in a class, leading to a conclusion about the number of students required to meet certain conditions.
Q & A
What is the formula to calculate the mean (average) for single data?
-The formula to calculate the mean (average) for single data is: X̄ = (X1 + X2 + ... + Xn) / n, where X̄ is the mean, Xn is the nth data point, and n is the number of data points.
What is the mode in statistics?
-The mode is the data point that appears most frequently in a dataset. It represents the value with the highest frequency.
How is the median calculated for both odd and even numbers of data?
-For odd data, the median is the middle value: X(n+1)/2. For even data, the median is the average of the two middle values: (Xn/2 + X(n/2+1)) / 2.
What is the formula for calculating the range of a dataset?
-The range is the difference between the largest and smallest data points in a dataset, calculated as: Range = X_max - X_min.
What are quartiles and how are they defined?
-Quartiles divide a dataset into four equal parts. The first quartile (Q1) is the value that separates the lowest 25% of data, the second quartile (Q2) is the median, and the third quartile (Q3) separates the highest 25% of data.
How do you calculate the interquartile range (IQR)?
-The interquartile range (IQR) is calculated as the difference between the third and first quartiles: IQR = Q3 - Q1.
What is the standard deviation formula?
-The standard deviation (s) is the square root of the variance (s^2). The variance is calculated as the average of the squared differences from the mean.
What is the formula for calculating the mean in grouped data?
-The formula for calculating the mean in grouped data is: X̄ = (F1X1 + F2X2 + ... + FmXm) / (F1 + F2 + ... + Fm), where Fi is the frequency of the data group, Xi is the midpoint of each class interval, and m is the number of classes.
How do you calculate the mode for grouped data?
-For grouped data, the formula for the mode is: Mo = L + [(D1) / (D1 + D2)] * P, where L is the lower boundary of the modal class, D1 and D2 are the differences between the frequencies of the modal class and the adjacent classes, and P is the width of the class interval.
In the example problem, how do we calculate the minimum number of students (m)?
-The minimum number of students (m) is calculated by setting up the equation for the average score based on the given data, using the formula: (N1 * X1 + N2 * X2) / (N1 + N2). By solving for m, we find that the minimum number of students is 15.
Outlines

This section is available to paid users only. Please upgrade to access this part.
Upgrade NowMindmap

This section is available to paid users only. Please upgrade to access this part.
Upgrade NowKeywords

This section is available to paid users only. Please upgrade to access this part.
Upgrade NowHighlights

This section is available to paid users only. Please upgrade to access this part.
Upgrade NowTranscripts

This section is available to paid users only. Please upgrade to access this part.
Upgrade NowBrowse More Related Video

STATISTIKA Part 2- Jangkauan, Kuartil dan Jangkauan interkuartil

Statistika Bagian 4 - Median dan Kuartil Data Tunggal dan Data Kelompok Matematika Wajib Kelas 12

Ukuran Pemusatan Data (Mean, Median, Modus dan Kuartil) - STATISTIKA Kelas 8
Statistika Deskriptif Ukuran Pemusatan dan Penyebaran Data | Zulfanita Dien Rizqiana, S.Stat., M.Si.
Cara menentukan nilai varian (Ragam) dan Standar deviasi (Simpangan baku) data tunggal dan kelompok

UKURAN PEMUSATAN DATA BERKELOMPOK | Rataan Median Modus Kuartil Desil Persentil
5.0 / 5 (0 votes)