Alur Belajar Excel untuk Data Analyst
Summary
TLDRIn this video, the creator explains the process of learning data analysis using Excel. The video highlights Excel's advantages such as its ease of use, comprehensive features for data manipulation, and its ability to create visualizations. Key concepts covered include basic data processing, Excel fundamentals, tools for data exploration (like Pivot tables and VLOOKUP), data cleaning, and visualization techniques. The video also introduces a mini bootcamp on data analysis with Excel at a very affordable price, offering an opportunity to learn through hands-on practice, assignments, and portfolio-building.
Takeaways
- 😀 Excel is widely used for data processing across businesses, especially by new companies or those with legacy systems still relying on Excel.
- 😀 Excel is easy to understand, even for non-IT people, and is often preferred over databases for presenting data to clients or managers.
- 😀 Excel offers a complete set of features for data manipulation, including cleaning, transformation, statistical analysis, and data visualization.
- 😀 One limitation of Excel is its data capacity, which is restricted to 1 million rows and 6,000 columns. This can affect performance when working with large datasets.
- 😀 Learning basic data processing concepts, such as statistics, data collection, and data cleaning, is essential when using Excel for data analysis.
- 😀 A solid understanding of Excel's interface, tools, and data formats is essential for effective data analysis. This includes using sorting, filtering, and understanding data types.
- 😀 Mastering basic Excel functions, such as SUM, AVERAGE, MEDIAN, MAX, MIN, and IF, is necessary for performing common data analysis tasks.
- 😀 Exploratory data analysis in Excel involves tools like Pivot Tables and VLOOKUP to summarize and merge datasets for better understanding.
- 😀 Functions such as IF (for logical operations) and combinations like SUMIF, COUNTIF, and IFERROR are valuable for analyzing data with conditions.
- 😀 Data cleaning and preprocessing in Excel includes removing duplicates, handling missing values, and modifying text, all of which are crucial for ensuring accurate analysis.
- 😀 Data visualization in Excel helps users better understand the data by using appropriate charts and graphs for different types of data, such as categorical, numerical, and relational data.
Q & A
Why is Excel considered an essential tool for data analysis?
-Excel is widely used because it is easy to understand and accessible to non-IT professionals. It is preferred by clients and managers for viewing data, and it offers a comprehensive set of features for tasks like data cleaning, manipulation, statistical analysis, and visualization.
What are the main advantages of using Excel for data analysis?
-Excel's main advantages include its ease of use, wide accessibility, and its ability to handle tasks like data cleaning, manipulation, statistical analysis, and visualization. It's also preferred by non-IT professionals and managers due to its straightforward interface.
What are some of the limitations of Excel when it comes to data analysis?
-Excel has limitations in terms of data capacity, being able to handle only 1 million rows and 6,000 columns. It can also become slow or unresponsive when working with large datasets or complex formulas.
What are the basic knowledge areas needed to start learning data analysis with Excel?
-To start learning data analysis with Excel, one should have basic knowledge of statistics, data collection, cleaning, transformation, and integration. Familiarity with these concepts is essential for understanding how to process and analyze data effectively.
What are the fundamental Excel skills necessary for data analysis?
-Basic Excel skills required for data analysis include knowing the interface (like the toolbar, ribbon, and worksheets), understanding different data types (e.g., date, time, numeric), and being able to perform simple data manipulations like sorting and filtering.
What are some commonly used Excel functions for data analysis?
-Commonly used Excel functions for data analysis include SUM, AVERAGE, MAX, MIN, MOD, and IF. These functions help with basic mathematical operations and conditional analysis, making them essential for analyzing datasets.
What is 'data exploration and analysis' in the context of Excel, and what tools can be used for it?
-Data exploration and analysis involves examining and understanding the characteristics of a dataset. In Excel, tools such as Pivot Tables, VLOOKUP, HLOOKUP, and IF functions are essential for summarizing, merging, and analyzing the data to uncover patterns and insights.
How do Excel's Pivot Tables assist in data analysis?
-Pivot Tables allow users to quickly summarize and analyze large datasets by reorganizing and aggregating the data into meaningful insights. This tool helps identify trends, totals, and other key metrics, making it easier to interpret the data.
What is the role of 'data cleaning and preprocessing' in Excel, and what tools are used?
-Data cleaning and preprocessing are crucial for ensuring the accuracy and consistency of a dataset. In Excel, tools like duplicate removal, handling missing values, and text modifications (using functions like SUBSTITUTE) are commonly used to clean and preprocess data.
How does data visualization in Excel help in understanding datasets?
-Data visualization in Excel helps users interpret data more easily by representing it in graphical formats. Visualization can include charts for categorical, numerical, or relationship data, and customizing these visualizations enhances the clarity and presentation of the data.
What is the focus of the Mini Bootcamp offered by Halotech Academy?
-The Mini Bootcamp focuses on teaching data analysis using Excel. It is not about Excel for data analysis in a general sense but is specifically tailored to data analysis, helping participants learn how to become data analysts using Excel as their primary tool.
Outlines

This section is available to paid users only. Please upgrade to access this part.
Upgrade NowMindmap

This section is available to paid users only. Please upgrade to access this part.
Upgrade NowKeywords

This section is available to paid users only. Please upgrade to access this part.
Upgrade NowHighlights

This section is available to paid users only. Please upgrade to access this part.
Upgrade NowTranscripts

This section is available to paid users only. Please upgrade to access this part.
Upgrade NowBrowse More Related Video
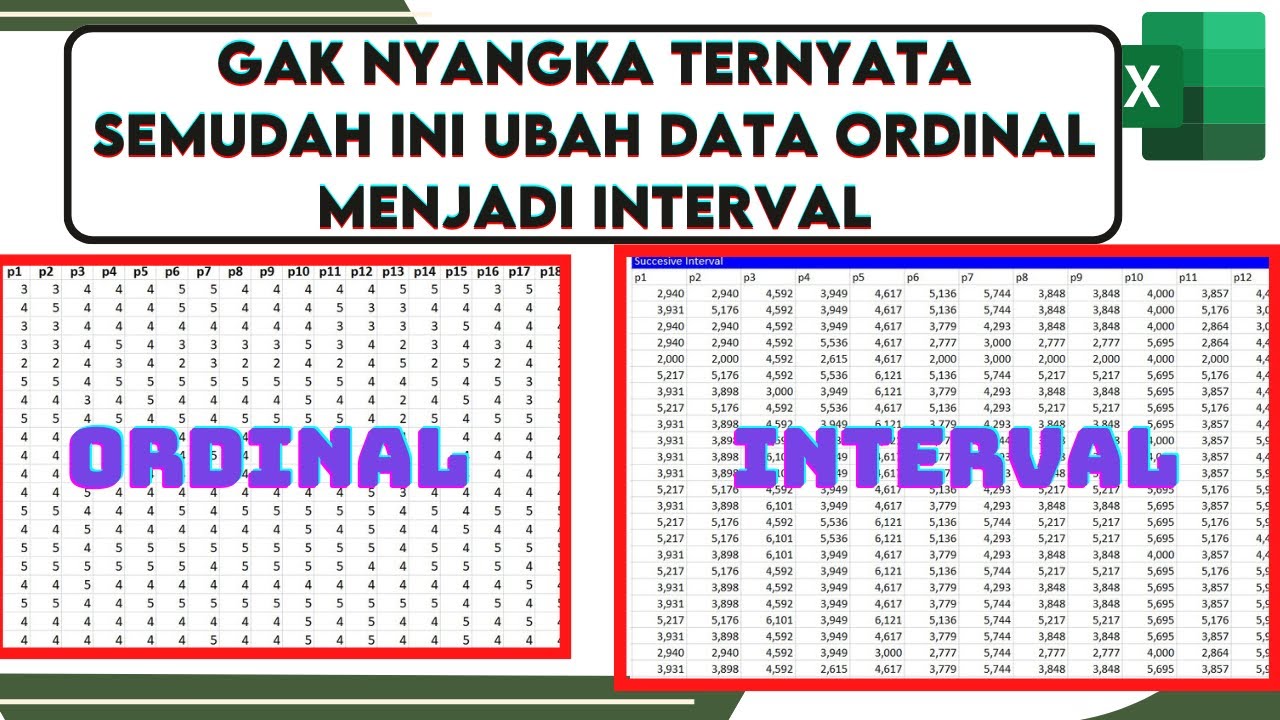
🔴Cara Mengubah Data Ordinal ke Interval Dengan excel | Mengubah data ordinal ke interval dengan MSI

Tutorial Lengkap mengolah data penelitian eksperimen menggunakan SPSS # PENELITIAN EKSPERIMEN PART 1
Kurikulum Merdeka Materi Informatika Kelas 7 Bab 6 Analisis Data Bagian 1

Pengoperasian Spektrofotometer Serapan Atom (SSA)

Importance Of Excel In Data Analysis | Fresher | Datawithkishan

Web scraper dasar (single page)
5.0 / 5 (0 votes)