y=mx+b Ecuacíon de la recta, relación funcional
Summary
TLDRIn this video, the teacher explores the concept of linear variation, specifically focusing on how to model real-life situations using algebraic expressions. Using a water tank example, the teacher explains how to translate everyday language into algebraic form, helping students understand the origins of the equation of a straight line. Through the example of water falling at a constant rate, the teacher illustrates how this leads to an equation of the form y = mx + b, emphasizing the importance of modeling, the role of constants and variables, and the interpretation of graphs. This is a comprehensive introduction to linear equations and their application in real-world scenarios.
Takeaways
- 😀 The teacher emphasizes the importance of understanding the origin of equations, specifically the equation of a line, and how it relates to real-life situations.
- 😀 One key difficulty for students is applying algebra to real-world scenarios, such as modeling problems using algebraic expressions.
- 😀 The concept of linear variation, or functional relationships, is introduced, showing how quantities change proportionally with respect to another variable.
- 😀 A practical example is given of water flowing through a faucet, with 3 liters of water falling per minute, and how to model this as an algebraic expression.
- 😀 The translation from a real-world problem to an algebraic expression is explained as a process called 'modeling,' using 'x' as the variable and '3' as the constant.
- 😀 The importance of creating tables for understanding how variables change over time is demonstrated, with values for 'x' (time in minutes) and the corresponding liters of water being calculated.
- 😀 The formula for the equation of the line is built step by step, where 'y' represents the amount of water in liters, and 'x' represents the time in minutes.
- 😀 Students are taught that the equation of a line, expressed as y = mx + b, represents a constant rate of change, with 'm' being the slope and 'b' being the y-intercept.
- 😀 The teacher introduces the concept of intercepts, showing that the value of 'b' is the starting amount (such as 10 liters in the tank) before the water starts flowing.
- 😀 The teacher uses a tool called GeoGebra to demonstrate how these equations generate straight lines on a graph, and how the slope changes with different constants (3x vs. 5x).
Q & A
What is the purpose of the video presented by Profe Toño?
-The purpose of the video is to explain the concept of linear variation and the equation of a line, specifically addressing how the equation of the straight line (y = mx + b) is formed and applied, especially in real-life scenarios such as calculating the amount of water flowing from a faucet.
What is 'modeling' as discussed in the video?
-Modeling refers to the process of translating a real-life situation into an algebraic expression. In this case, the real-life example of water flowing from a faucet is translated into an algebraic expression to represent the rate of water flow per minute.
Why do students often struggle with algebra according to Profe Toño?
-Students struggle with algebra because they have difficulty connecting algebraic expressions to real-life problems. Without understanding how to model real-world situations using algebra, students often find the subject abstract and difficult.
What is the importance of 'variación lineal' or linear variation in understanding the equation of a line?
-Linear variation is important because it explains how a quantity changes in a constant and proportional manner. In the video, Profe Toño uses this concept to show how the amount of water flowing from a faucet increases consistently over time, which helps students understand the relationship between the variables in the equation of a line.
How does the water tank example help explain the equation of a line?
-The water tank example helps illustrate how water flows at a constant rate (3 liters per minute). This example is used to create a simple algebraic expression (3x) where 'x' represents time in minutes and the result (3x) gives the amount of water accumulated, which forms a linear relationship that can be plotted as a straight line.
What does the constant '3' represent in the water tank example?
-The constant '3' represents the amount of water flowing into the tank per minute. It is the rate at which the water accumulates, and it is a constant value that does not change over time.
What role does the variable 'x' play in the equation discussed in the video?
-In the equation, 'x' represents time in minutes. The value of 'x' determines how much water has accumulated in the tank after a certain period, with the amount increasing by 3 liters for each minute that passes.
What happens when there are additional liters already in the tank before water starts flowing?
-When there are additional liters already in the tank, the equation changes. For example, if there were 10 liters in the tank before the faucet was turned on, the equation would include this initial amount as an added constant (y = 3x + 10), which shifts the starting point of the graph vertically.
How does the equation y = mx + b represent the behavior of water flowing into the tank?
-In the equation y = mx + b, 'm' represents the constant rate of water flow (3 liters per minute), 'x' is the time in minutes, and 'b' is the initial amount of water already in the tank. This equation models how the water amount increases linearly over time, with a slope (m) showing how quickly the water accumulates and an intercept (b) showing the starting point of the water amount.
What is the significance of the term 'slope' in the context of the equation y = mx + b?
-The term 'slope' in the equation represents the rate of change of the water amount with respect to time. In the context of the water tank example, the slope (m) tells us how much water is added to the tank each minute, indicating the steepness of the line when plotted on a graph. A higher slope means the water is flowing faster.
Outlines

This section is available to paid users only. Please upgrade to access this part.
Upgrade NowMindmap

This section is available to paid users only. Please upgrade to access this part.
Upgrade NowKeywords

This section is available to paid users only. Please upgrade to access this part.
Upgrade NowHighlights

This section is available to paid users only. Please upgrade to access this part.
Upgrade NowTranscripts

This section is available to paid users only. Please upgrade to access this part.
Upgrade NowBrowse More Related Video
Hlm 124 - 132 Part 1 BENTUK ALJABAR MATEMATIKA SMP KELAS 7 KURIKULUM MERDEKA

Translating Real-life Situations to Algebraic Expressions | 1st Quarter Grade 8 Matatag Revised K-12
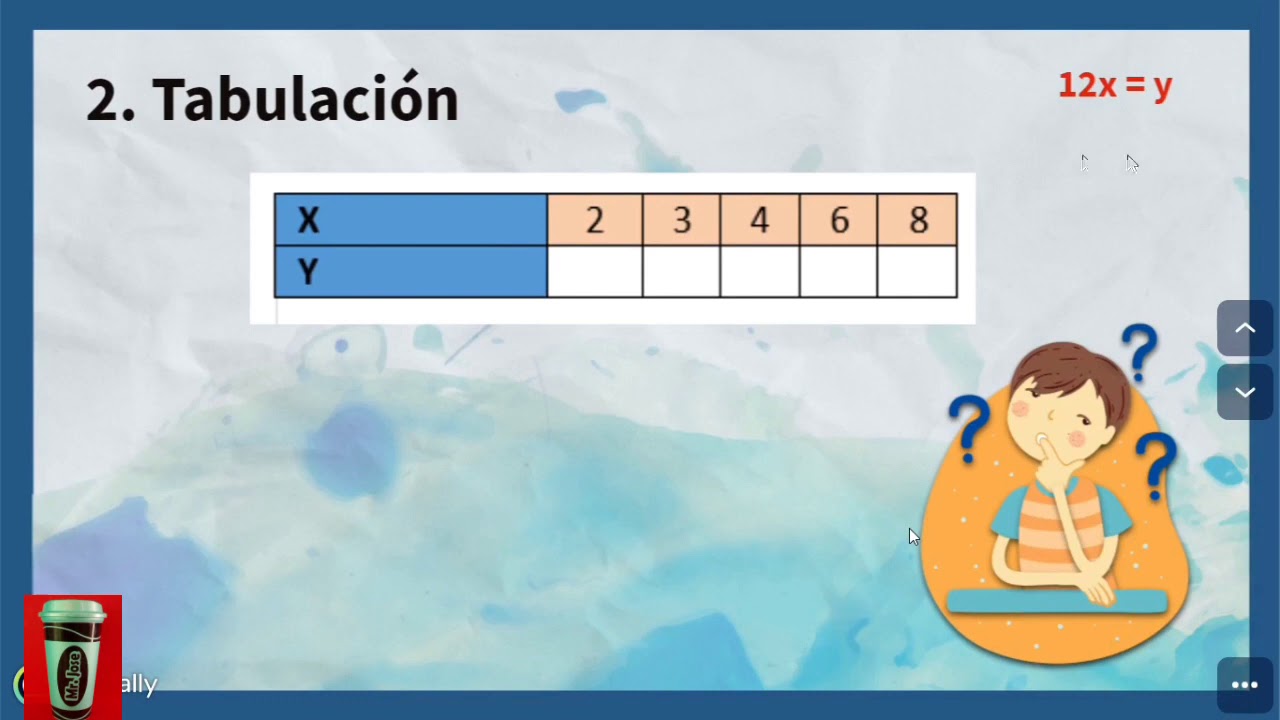
Variación lineal: expresión algebraica, tabulación y gráfica.

INVERSE VARIATION || GRADE 9 MATHEMATICS Q2
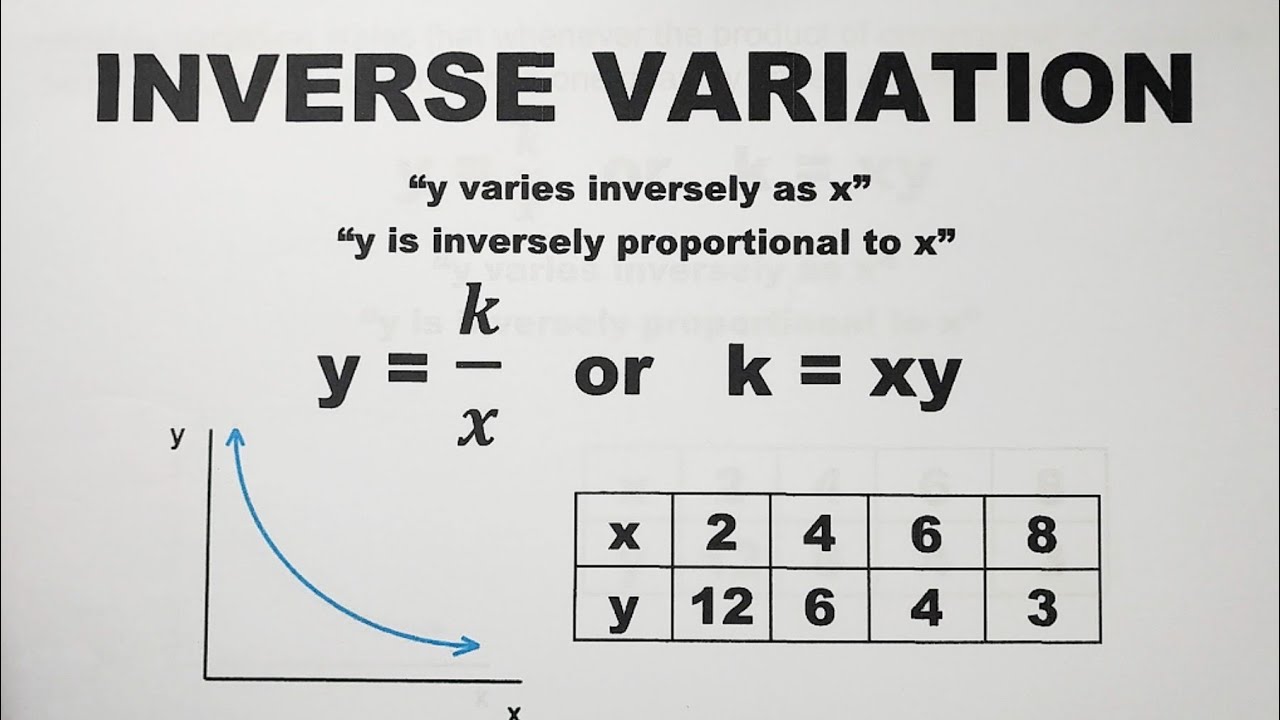
Inverse Variation - Constant of Variation and Equation - Grade 9 Math Second Quarter
PT3 KSSM Mathematics Form 1 (Algebraic Expressions) Chapter 5 Complete Revision
5.0 / 5 (0 votes)