Kalkulus 1: Fungsi dan Grafik Fungsi
Summary
TLDRThis educational video explores the concept of functions in mathematics, explaining the definition, conditions, and examples of valid and invalid functions. It covers the relationship between domain and codomain, ensuring that each element of the domain is paired with exactly one element of the codomain. The video also discusses how to graph functions, providing examples such as linear functions and quadratic functions. Viewers will learn how to interpret and create function graphs, making abstract concepts more tangible through visual representations and step-by-step explanations.
Takeaways
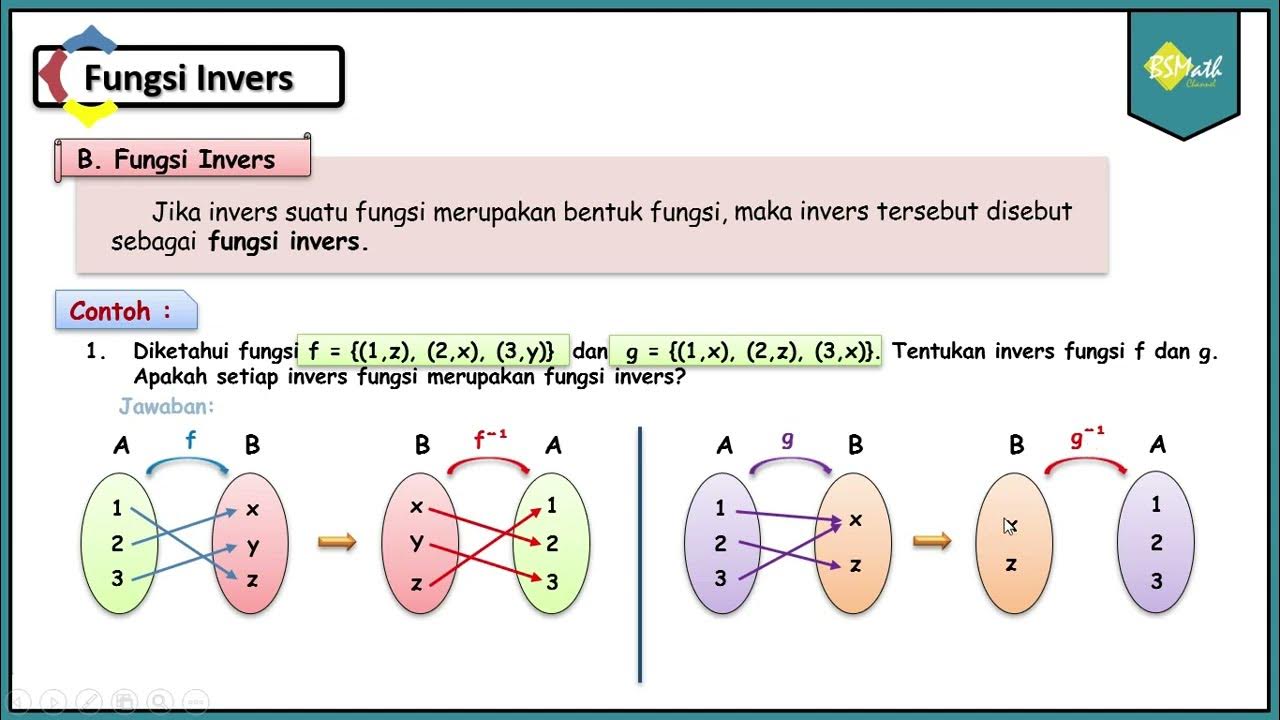
- 😀 A function is a rule that associates each element from a domain (set A) with exactly one element in a codomain (set B).
- 😀 For a relation to be a function, each element of the domain must be paired with exactly one element from the codomain.
- 😀 In a valid function, all elements of the domain must be paired with elements in the codomain, and no element in the domain should have multiple pairs.
- 😀 The domain (set A) is the set of input values, while the codomain (set B) is the set of possible output values for the function.
- 😀 A function’s result set, or ‘range’, is the set of values that result from applying the function to all elements of the domain.
- 😀 A non-function occurs when an element in the domain has multiple corresponding elements in the codomain, or some domain elements are unpaired.
- 😀 The graph of a function consists of points (x, y) that satisfy the function's rule, where x is an element from the domain, and y is the resulting output.
- 😀 To graph a function, list x-values, calculate corresponding y-values using the function's equation, and plot the points on a graph.
- 😀 The function y = x + 1 was demonstrated, where each x-value (e.g., 1, 2, 3) produces corresponding y-values (e.g., 2, 3, 4).
- 😀 Another example was the function y = x², where points were calculated for x-values such as 1, 2, -1, and plotted to form a curve.
- 😀 The more points you use in graphing a function, the more accurate and clear the graphical representation becomes.
Please replace the link and try again.
Outlines

This section is available to paid users only. Please upgrade to access this part.
Upgrade NowMindmap

This section is available to paid users only. Please upgrade to access this part.
Upgrade NowKeywords

This section is available to paid users only. Please upgrade to access this part.
Upgrade NowHighlights

This section is available to paid users only. Please upgrade to access this part.
Upgrade NowTranscripts

This section is available to paid users only. Please upgrade to access this part.
Upgrade NowBrowse More Related Video

FUNCTIONS: Composite Function and its Domain

Corso zero di matematica (lezione 2) - Funzioni tra insiemi
Fungsi Invers - Matematika SMA Kelas XI Kurikulum Merdeka

Algebra Basics: What Are Functions? - Math Antics
FOURIER SERIES LECTURE 1 | STUDY OF DEFINITION AND ALL BASIC POINTS @TIKLESACADEMY

Functions
5.0 / 5 (0 votes)