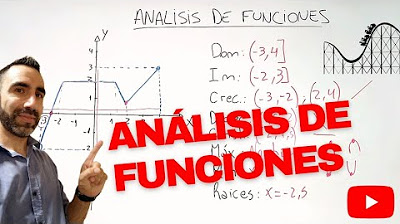
Funciones.Dominio, recorrido, cortes, continuidad, crecimiento, decrecimiento, máximos, mínimos
Takeaways
- 😀 The domain of a function consists of the set of possible values for the independent variable (x). It is determined by identifying the leftmost and rightmost points where the function is defined, including or excluding endpoints as necessary.
- 😀 The range of a function refers to the set of possible values for the dependent variable (y). It is determined by looking at the highest and lowest points on the graph and considering if the function approaches but doesn't reach certain values.
- 😀 The x-intercepts are the points where the function crosses the x-axis, which are identified by setting y = 0 and finding the corresponding x values. Example intercepts include (-3, 0), (-2.5, 0), and (-0.5, 0).
- 😀 The y-intercept is the point where the function crosses the y-axis, and the value of x is always 0 at this point. In this case, the y-intercept is (0, -1).
- 😀 Continuity in a function means it can be drawn without lifting the pen. If there is a jump, like at x = 2, the function is discontinuous there, and this is called a jump discontinuity.
- 😀 Growth intervals are regions where the function increases as x increases. In this case, the function is increasing in the intervals (-3, -2), (1, 2), and (3, ∞).
- 😀 Decrease intervals are regions where the function decreases as x increases. The function is decreasing in the intervals (-∞, -3) and (-2, 1).
- 😀 Maximum points are where the function reaches a local peak, such as at (-2, 3), which is a relative maximum.
- 😀 Minimum points are where the function reaches a local low, such as at (-3, -2) and (1, -3). One of these minima is an absolute minimum because no other points are lower.
- 😀 The function does not exhibit symmetry or periodicity, meaning it doesn't mirror itself over the y-axis or repeat in regular intervals.
- 😀 The rate of change between two points on the function indicates whether the function is increasing or decreasing. For example, between -3 and -2, the rate of change is positive, indicating growth.
Q & A
What is the domain of a function?
-The domain of a function refers to the set of all possible values that the independent variable (x) can take. In this case, the function starts at negative infinity and continues to a point near 2, where it jumps and then progresses from 3 to positive infinity.
What is the significance of using parentheses and brackets when describing the domain?
-Parentheses indicate that a value is not included in the domain, while brackets mean the value is included. For instance, a domain from negative infinity to 2 uses parentheses because 2 is not included, while the domain from 3 to infinity uses a bracket because 3 is included.
How do you define the range of a function?
-The range of a function is the set of all possible values that the dependent variable (y) can take. In this script, the range starts at -3 and continues to positive infinity, with certain points being excluded or included depending on whether they are part of the graph.
What are the points of intersection with the x-axis and y-axis?
-Points of intersection with the x-axis occur where y = 0. The script lists various intersection points, such as (-3, 0), (-2.6, 0), and others. For the y-axis, the x-coordinate is always 0, and one such point is (0, -1).
What does continuity mean for a function?
-A function is continuous if it can be drawn without lifting the pen from the paper. In this case, the function has a discontinuity at x = 2, where it makes a finite jump.
What is the difference between a relative maximum and an absolute maximum?
-A relative maximum is a point that is higher than its immediate neighbors, while an absolute maximum is the highest point on the entire graph. The script discusses a relative maximum at x = -2, y = 3, and the absolute maximum is also at that point.
How do you determine whether a function is increasing or decreasing?
-A function is increasing when the y-values grow as the x-values increase. Similarly, it is decreasing when the y-values decrease as the x-values increase. In the script, growth and decay are identified through intervals on the graph, such as from -3 to -2 and from 3 to infinity.
What does the rate of variation between two points tell us?
-The rate of variation tells us how much the function's value changes between two x-values. For example, the rate of variation between -5 and -3 indicates that the function is decreasing, as the y-value goes from 5 to -2.
What is the concept of symmetry in a function?
-Symmetry in a function means that the graph can be reflected or rotated in some way and still look the same. According to the script, there is no symmetry in the function, as it does not exhibit reflectional or rotational symmetry.
How do we handle intervals where the function is neither growing nor decreasing?
-In intervals where the function is neither growing nor decreasing, we consider it to be constant. The script mentions that at points where the function changes direction but does not increase or decrease, it is considered 'paused' or 'flat'.
Outlines

This section is available to paid users only. Please upgrade to access this part.
Upgrade NowMindmap

This section is available to paid users only. Please upgrade to access this part.
Upgrade NowKeywords

This section is available to paid users only. Please upgrade to access this part.
Upgrade NowHighlights

This section is available to paid users only. Please upgrade to access this part.
Upgrade NowTranscripts

This section is available to paid users only. Please upgrade to access this part.
Upgrade NowBrowse More Related Video

Derivadas Máximos, Mínimos, Crecimientos y Concavidad
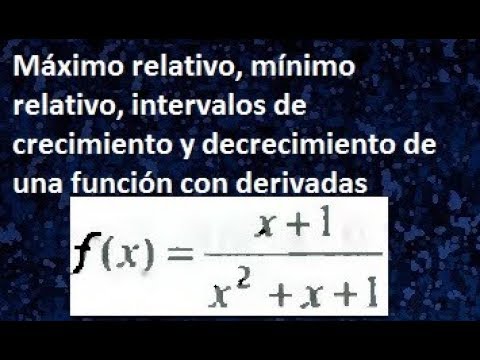
Máximo relativo, mínimo relativo, intervalos de crecimiento y decrecimiento de una función
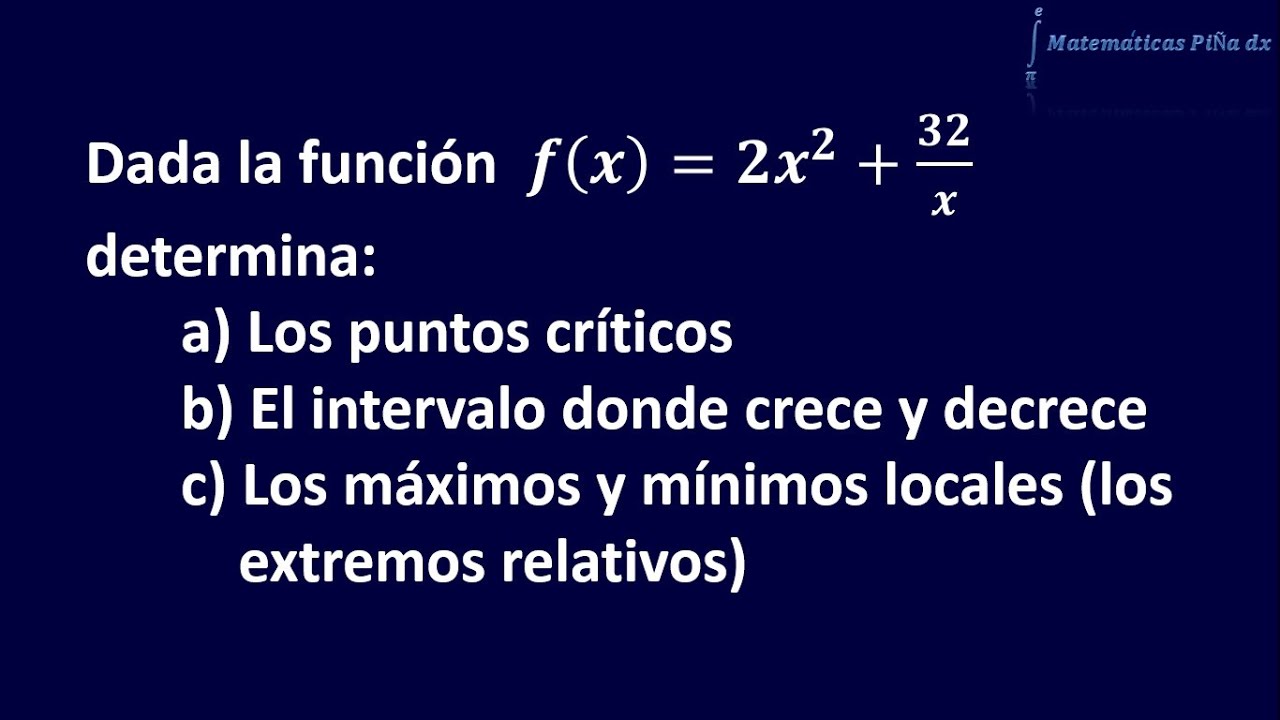
Puntos críticos, intervalos donde crece y decrece, máximos y mínimos de una función 2
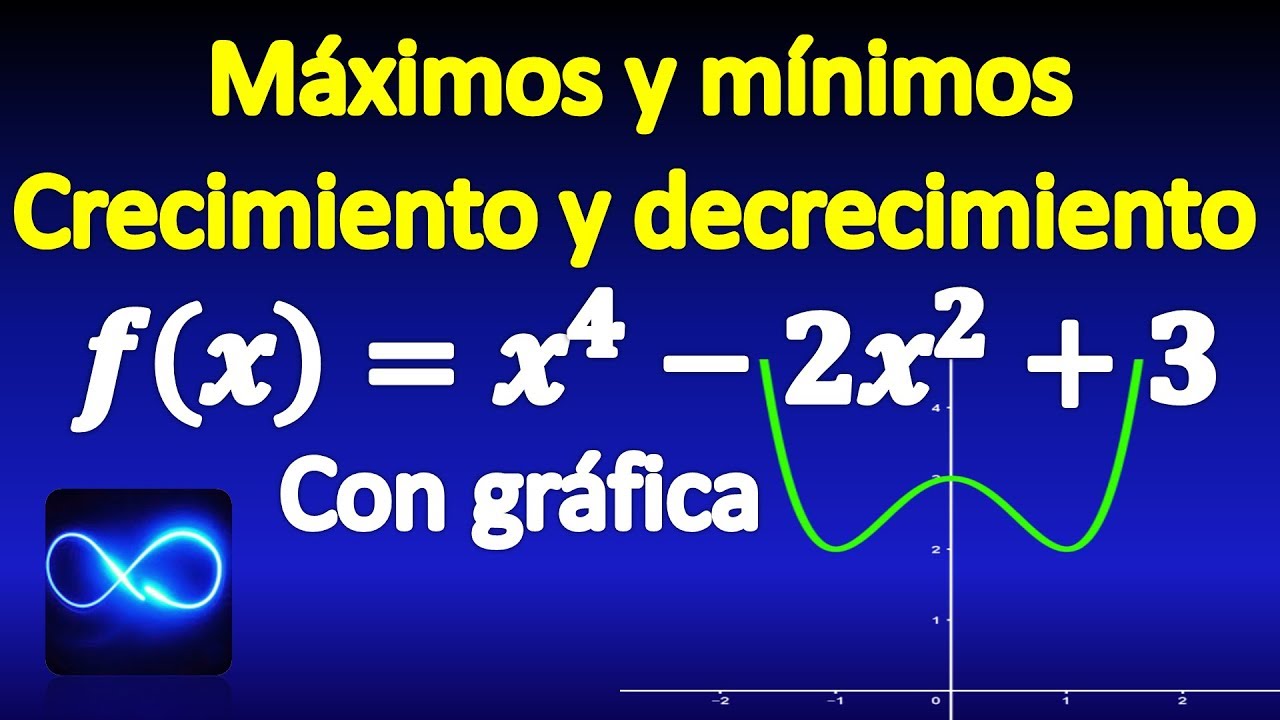
04. Maximum, minimum, growth and decrease: criterion of the first derivative
ANÁLISIS DE FUNCIONES

Puntos críticos, crece y decrece, máximos y mínimos locales, inflexión y concavidad de una función 1
5.0 / 5 (0 votes)