Perbedaan Antara Statistika Deduktif dan Statistika Induktif dalam Analisis Data
Summary
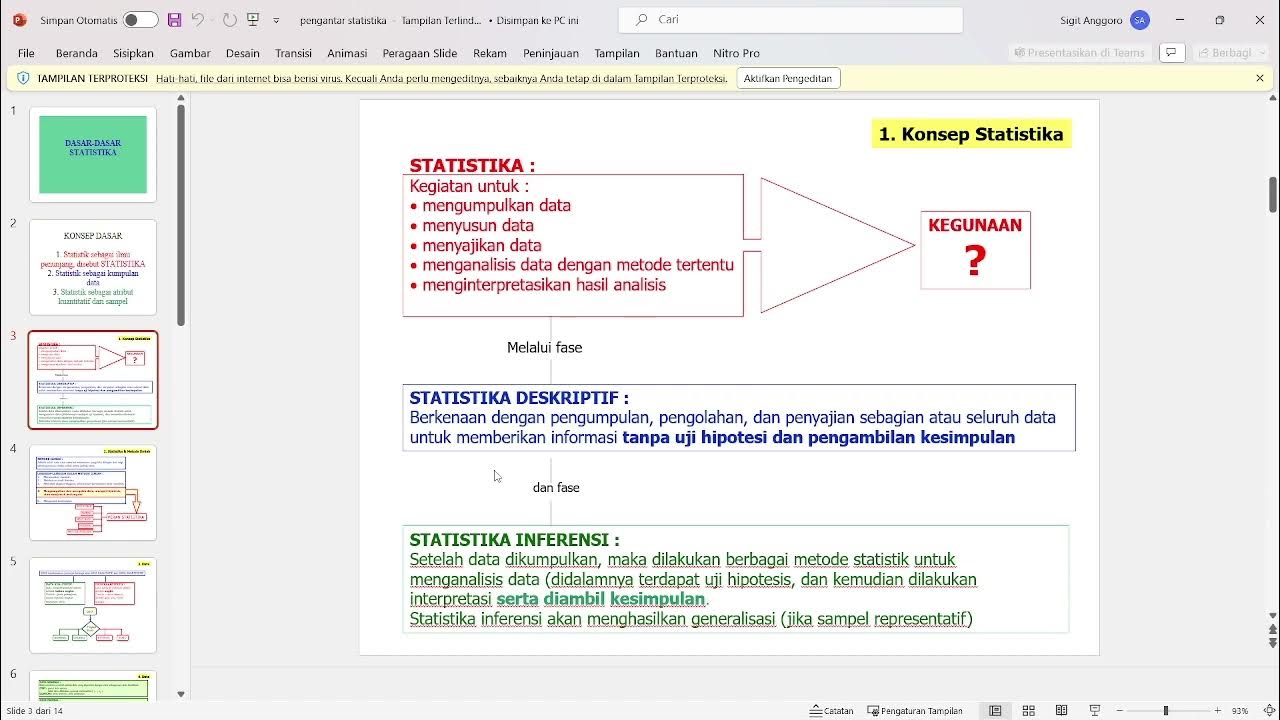
TLDRThe video explains the essential differences between descriptive statistics and inductive statistics. Descriptive statistics summarizes and presents data from a sample without making broader conclusions, while inductive statistics uses sample data to infer characteristics of a larger population. The discussion emphasizes the depth of analysis and the scope of data usage in each statistical method, providing examples to clarify these concepts. The speaker encourages further exploration of statistics, highlighting its relevance and application in everyday life, aiming to enhance understanding and promote the sharing of knowledge.
Takeaways
- 😀 Statistics is divided into two main categories: inductive and descriptive statistics.
- 📊 Descriptive statistics summarizes and describes data without making broader inferences.
- 🔍 Inductive statistics makes predictions and generalizations about a larger population based on a sample.
- 📈 The depth of analysis in inductive statistics is greater compared to descriptive statistics.
- 🗃️ Descriptive statistics relies solely on the data available, while inductive statistics uses samples to infer about wider groups.
- 📋 The statistical process includes planning, data collection, processing, analysis, interpretation, and conclusion.
- 🔑 Key terms include 'exploratory data analysis' for descriptive statistics and 'confirmatory data analysis' for inductive statistics.
- ⚖️ Hypothesis testing is a critical component of inductive statistics, allowing for validation of assumptions.
- 📚 An example illustrated how an average weight from a sample can inform about the entire population's average weight using inductive reasoning.
- 🌱 Continuous learning and sharing of statistical knowledge are essential for personal and professional growth.
Q & A
What is the main focus of the video?
-The video focuses on understanding the differences between descriptive statistics and inductive statistics.
What are the two major types of statistics discussed?
-The two major types of statistics discussed are inductive statistics and deductive statistics.
How does inductive statistics differ from descriptive statistics?
-Inductive statistics involves deeper and broader analysis beyond the data at hand, allowing conclusions to be drawn for larger populations based on sample data, whereas descriptive statistics only summarizes and describes the data available.
What is meant by exploratory data analysis (EDA)?
-Exploratory data analysis (EDA) refers to a set of techniques for summarizing and visualizing data to understand its main characteristics, often using graphical representations.
What role does hypothesis testing play in inductive statistics?
-In inductive statistics, hypothesis testing is used to determine the validity of assumptions or predictions about a population parameter based on sample data.
What example is provided to illustrate descriptive statistics?
-The example given is about calculating the average weight of a sample of 275 students and stating that the average weight is 62.25 kg, which describes the data without making broader conclusions.
What conclusion can be drawn from the inductive statistics example provided?
-The inductive statistics example concludes that the average weight of all students at a university can be estimated to be between 60.25 kg and 63.25 kg, using the sample data to make inferences about the larger population.
What are some techniques used in exploratory data analysis?
-Techniques used in exploratory data analysis include calculating statistical measures like central tendency, dispersion, and visualizing data through graphs and tables.
What is the significance of the sampling technique mentioned?
-The sampling technique is significant because it allows researchers to draw conclusions about a large population (46,025 students) from a manageable sample size (275 students), making statistical analysis feasible.
How does the speaker suggest improving understanding of statistics?
-The speaker suggests that further independent study and exploration of the concepts discussed will enhance understanding of statistics and its applications.
Outlines

This section is available to paid users only. Please upgrade to access this part.
Upgrade NowMindmap

This section is available to paid users only. Please upgrade to access this part.
Upgrade NowKeywords

This section is available to paid users only. Please upgrade to access this part.
Upgrade NowHighlights

This section is available to paid users only. Please upgrade to access this part.
Upgrade NowTranscripts

This section is available to paid users only. Please upgrade to access this part.
Upgrade Now5.0 / 5 (0 votes)


