Cuidados com análise de correlação

FM2S Educação e Consultoria
30 May 202204:50

Summary

TLDRThe video script discusses the importance of distinguishing between correlation and causality in data analysis. It uses historical examples, such as the mistaken belief that radio waves caused mental illness, to illustrate the danger of assuming causal relationships from correlated data. The script emphasizes the need for careful analysis and experimental validation to determine true causality, warning against drawing conclusions from mere coincidences, as demonstrated by the humorous example of Nicolas Cage's movies correlating with swimming pool drownings.

Takeaways

  • 🔍 The importance of understanding the difference between correlation and causality in data analysis.
  • 🧐 Correlation between two variables in a database does not imply that one causes the other.
  • 📈 Famous historical example: A strong correlation between radio ownership and mental illness rates in England was misunderstood as causal.
  • 🌐 The role of external factors such as World War I, which influenced both the increase in radio ownership and the number of mental health patients.
  • 🤔 The need for careful data analysis and controlled experiments to evaluate potential causality.
  • 🌟 The concept of spurious correlations, where unrelated factors coincidentally show a correlation.
  • 🎬 The humorous example of the correlation between the number of people drowning in swimming pools and the number of Nicolas Cage movies.
  • 🎶 Another example of spurious correlation: the relationship between the price of oil and the number of rock albums released.
  • ⚠️ The warning to be cautious when analyzing data to avoid drawing incorrect conclusions from coincidental correlations.
  • 📊 The use of graphs, such as scatter plots, to illustrate correlations and the potential for misinterpretation.
  • 🔑 The key takeaway of the script is the critical evaluation of data relationships and the necessity of experimental validation for causality.

Q & A

  • What is the main misconception about correlation discussed in the script?

    -The main misconception discussed is the assumption that just because two variables are correlated, one must cause the other. This is not necessarily true, as correlation does not imply causation.

  • What is the historical example used in the script to illustrate the difference between correlation and causality?

    -The historical example used is the correlation between the number of radios and the number of mental patients per 100,000 inhabitants in England between 1910 and 1920. The misconception was that radios caused mental illness, but the actual cause was the World War I, which increased both the production of radios and the number of mental patients.

  • How does the script suggest we should approach data analysis to avoid the correlation-causation fallacy?

    -The script suggests that we should always be cautious when analyzing data, perform controlled experiments to evaluate whether a correlation actually implies causation, and not jump to conclusions based solely on observed correlations.

  • What is the term used in the script to describe absurd correlations found in some data?

    -The term used is 'spurious correlations', which refers to correlations that are coincidental and do not have a causal relationship.

  • How does the script use the example of Nicolas Cage movies to illustrate spurious correlations?

    -The script mentions a spurious correlation between the number of people who died from drowning in swimming pools and the number of Nicolas Cage movies. It humorously suggests that Nicolas Cage's presence in movies causes more people to drown, which is, of course, not true.

  • What is the importance of controlled experiments in data analysis according to the script?

    -Controlled experiments are important because they help to determine whether there is actual causation behind observed correlations. They allow analysts to test hypotheses and rule out coincidental relationships.

  • What is the role of the 'correlation does not imply causation' principle in the field of statistics?

    -This principle is crucial in statistics as it serves as a reminder to analysts to not infer causation from mere correlation. It helps prevent the drawing of incorrect conclusions from data analysis.

  • What is the relevance of the script's discussion on the misuse of correlation in historical context?

    -The historical context serves as a cautionary tale about the dangers of misinterpreting data. It emphasizes the need for careful analysis and understanding of the factors that might influence correlations to avoid drawing false conclusions.

  • How does the script suggest we should interpret correlations found in large databases?

    -The script suggests that we should be skeptical of correlations found in large databases and investigate further to determine if they are the result of coincidental relationships or if they indicate a true causal relationship.

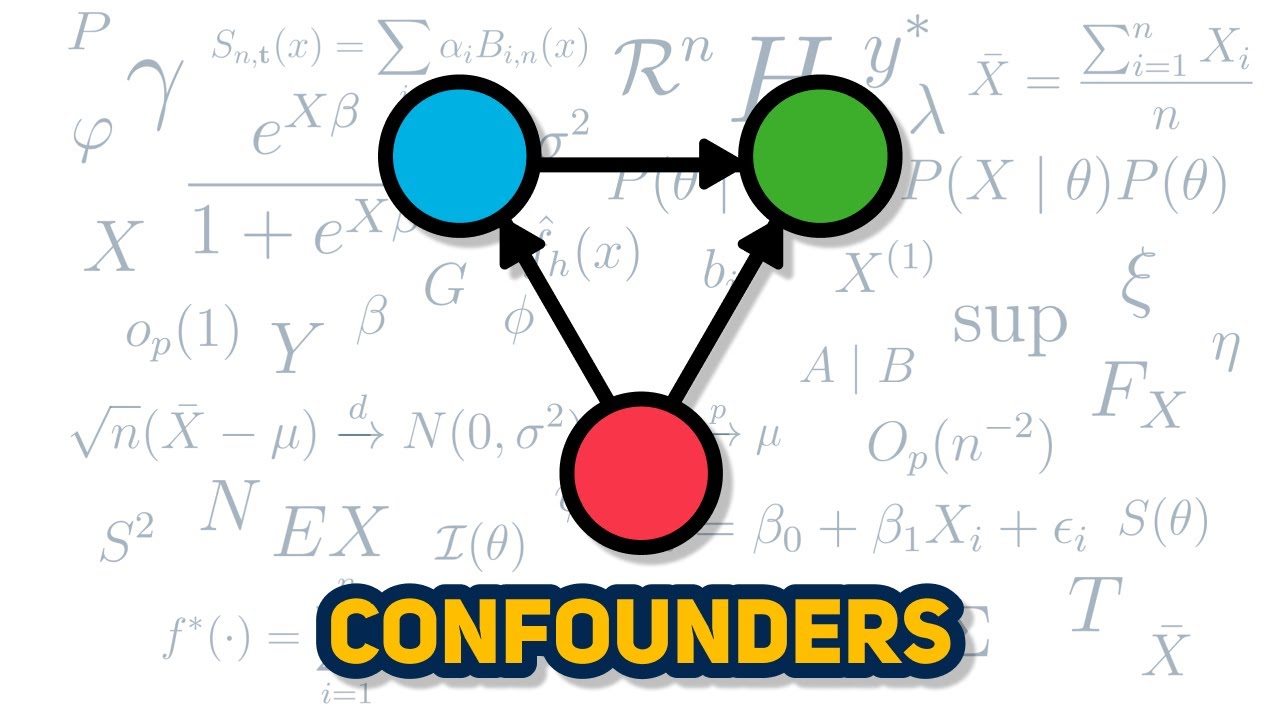
  • What is the significance of the script's mention of a third event causing two correlated phenomena?

    -The mention of a third event causing two correlated phenomena highlights the possibility of confounding variables. It underscores the importance of considering all potential factors that could lead to observed correlations and not just the apparent relationship between two variables.

  • What advice does the script give for concluding an analysis phase?

    -The script advises that the most important aspect of concluding an analysis phase is to develop changes and insights from the findings. It emphasizes the need to revisit and re-evaluate the data and analysis to ensure accurate and meaningful conclusions.

Outlines

00:00

🔍 Understanding Correlation and Causality

The paragraph discusses the importance of distinguishing between correlation and causality when analyzing data. It uses the historical example of a statistician who found a strong correlation between the number of radio stations and the number of mental health patients in England between 1910 and 1920. However, this correlation was not due to radio stations causing mental health issues, but rather both were influenced by World War I. The paragraph emphasizes the need for careful data analysis and experimental validation to determine if observed relationships imply causality or are mere coincidences. It also mentions a website known for highlighting spurious correlations, such as the number of people dying in swimming pools correlating with the number of Nicolas Cage movies, illustrating the importance of not jumping to conclusions based on correlations alone.

Mindmap

Keywords

💡Correlation

Correlation refers to a statistical relationship between two variables, indicating how one variable changes in relation to another. In the video, the speaker emphasizes the importance of not confusing correlation with causation, as two variables may be related without one causing the other to occur. The example of radio usage and mental illness rates illustrates this point, showing that while they are correlated, the increase in both is due to World War I, not a direct causal link.

💡Causality

Causality is the relationship between cause and effect, where one event (the cause) brings about another event (the effect). The video script warns against assuming causality from mere correlation, as demonstrated by the historical misconception that radio waves caused mental illnesses. Causality must be established through rigorous testing and evidence, not just by observing that two variables move together.

💡Data Analysis

Data analysis involves inspecting, cleaning, transforming, and modeling data to extract useful information, draw conclusions, and support decision-making. In the context of the video, the speaker discusses the pitfalls of data analysis, particularly the misinterpretation of correlations as causal links. Proper data analysis requires careful consideration of the relationships between variables and the need for confirmatory experiments to establish causality.

💡Spurious Correlations

Spurious correlations are relationships that appear statistically significant but have no actual causal connection. These correlations can be misleading and are often the result of chance or confounding factors. The video script uses the example of the number of people drowning in pools correlating with the number of Nicolas Cage movies to illustrate the absurdity of drawing causal conclusions from spurious correlations.

💡World War I

World War I, also known as the Great War, was a global war originating in Europe that lasted from 1914 to 1918. In the video, the speaker uses the historical context of World War I to explain the concurrent increase in radio usage and mental illness rates, emphasizing that correlation does not imply causation. The war acted as a confounding factor, influencing both variables independently.

💡Statistical Significance

Statistical significance is a measure used to determine if the results of a study or the observed correlation between variables are likely due to chance or if there is a strong evidence of a real effect. In the video, the speaker cautions viewers to not automatically assume causality from statistically significant correlations, as these correlations might be the result of confounding factors rather than direct causation.

💡Confounding Factors

A confounding factor is an external variable that affects the relationship between two other variables, making it difficult to determine if a true causal relationship exists. In the video, World War I is presented as a confounding factor that influenced both the increase in radio usage and the rise in mental illness rates, thus obscuring any direct causal link between the two.

💡Experiments

Experiments are research studies in which one or more variables are manipulated to determine their effect on other variables. The video emphasizes the importance of conducting experiments to test for causality, as mere observation of correlations is insufficient to establish cause and effect. Experiments help control for confounding factors and provide stronger evidence for causal relationships.

💡Rock Music

Rock music is a genre of popular music that originated in the 1950s and evolved into various subgenres over time. In the video, the speaker humorously mentions the correlation between the price of oil and the number of rock music CDs released in the 1970s, highlighting how unrelated variables can sometimes show coincidental correlations.

💡Mental Illness

Mental illness refers to a wide range of mental health conditions that affect a person's mood, thinking, and behavior. In the video, the speaker discusses the historical misconception that linked the increase in radio usage with a rise in mental illness rates, using this example to illustrate the importance of distinguishing correlation from causation.

💡Nicolas Cage

Nicolas Cage is an American actor known for his roles in various films. In the video, his name is used in a humorous example of a spurious correlation, suggesting that the number of people drowning in pools increases with the number of his movies, which is an absurd correlation without any causal basis.

Highlights

Discussing the power of correlation technique and its proper use.

The importance of distinguishing between correlation and causality in data analysis.

The historical example of a strong correlation between radio ownership and mental illness rates in England from 1910 to 1920.

The misconception that radio waves cause mental illness due to a correlation.

The role of World War I in increasing both radio production and the number of mental health patients.

The need for careful data analysis and controlled experiments to assess causality.

The concept of spurious correlations and the famous statistician who debunked the radio and mental illness myth.

The example of the correlation between the number of people who died from drowning in swimming pools and the number of Nicolas Cage movies.

The absurdity of attributing causality to coincidental correlations.

The website that showcases absurd correlations to illustrate the concept of spurious relationships.

The correlation between the price of oil and the number of rock albums released in the 1970s.

The cautionary tale of mistaking correlation for causation in data analysis.

The importance of reevaluating and refining analysis methods based on insights gained from previous phases.

The transition from the analysis phase to the implementation phase.

The value of developing changes and improvements based on the analysis of cheese examples.

The significance of understanding the limitations and potential errors in data analysis techniques.

The reminder to always question and verify the relationships found in data to ensure accurate conclusions.

Transcripts

play00:00

e a pessoa então agora que a gente já

play00:02

viu aí essa tudo poder da técnica de

play00:04

correlação né gente é discutir um pouco

play00:06

isso eu queria terminar essa parte e

play00:08

terminar também a nossa fase Dona lá e

play00:10

com um pequena é

play00:13

um pequeno aviso na em alguns cuidados

play00:17

que a gente tem que ter quando a gente

play00:18

usa gráfico dispersão é análise de

play00:20

correlação em Minas Gerais tá a primeira

play00:23

coisa que a gente tem que entender é

play00:25

sempre com relação né o a relação entre

play00:27

correlação e causalidade não é porque

play00:30

dois dados vão estar

play00:32

correlacionadas no banco de dados nas

play00:34

duas variáveis estão correlacionadas em

play00:37

um banco de dados que uma causa a outra

play00:40

na TV tudo histórico que ficou muito

play00:42

famoso que era esse daqui dos Rádios não

play00:44

é feito pelo piercing famoso estatístico

play00:46

né ele pegou coletou lavar os dados e

play00:49

uma população é entre os anos de 1910 e

play00:53

1920 por ele viu lá na que tinha uma

play00:57

correlação muito forte entre o no é de

play01:01

rádio e milhões que tinha naquela região

play01:03

na Inglaterra e a o número de doentes

play01:06

mentais por 100 mil habitantes traz aqui

play01:09

já está normalizado população acresceu

play01:11

que a população cresceu não né ele viu

play01:14

que nossa tem uma correlação muito forte

play01:16

entre quanto mais rádios mais a doentes

play01:20

mentais Tinho podia surgir aquela

play01:23

questão Nossa olhando esse gráfico os

play01:26

raios causam loucuras né então nossas

play01:28

ondas de rádio maligna passam pela

play01:31

cabeça das pessoas e elas enlouquecem né

play01:33

era uma discussão por ele tá acontecendo

play01:35

na época a gente não tinha ainda noção

play01:37

de que o rádio aí no sensível é então a

play01:40

gente pode ser isso aqui mas não né no

play01:42

caso a elas apesar de estarem com

play01:45

relacionadas elas não têm causalidades

play01:48

né porque elas estão correlacionados

play01:50

pode até pensar preparar é parar para

play01:52

pensar sobre isso né nós que entre 1910

play01:55

1920 poucos teve lá um grande evento é

play01:59

que foi a Guerra Mundial e aumentou

play02:03

substancialmente o número de rádios

play02:05

produzidos Então pode estão produzindo

play02:06

rádio lá para o esforço de guerra Ei

play02:09

também a guerra aumentou o número de

play02:12

doentes mentais Então apesar de rádio e

play02:15

do enfrentar estarem com relação às um

play02:17

não causa outro os dois são causados

play02:20

pela guerra né esse é o evento que da

play02:22

liga nos dois a pessoa aqui não tá

play02:24

ficando louca porque tá passando onda de

play02:27

rádio na cabeça dela mas a ficando louco

play02:29

porque ela tá numa de encher mas foi

play02:30

tirada na casa dela esperam a trincheira

play02:32

com outra cara deu tiro em cima dele

play02:34

jogando bomba 24 horas por dia tentando

play02:37

Natal né esse daí que enlouqueceu e o

play02:40

raio também verde para subir águia né

play02:42

então a correlação e causalidade nem

play02:45

sempre estão andam juntos a gente tem

play02:48

que sempre tomar muito cuidado com as

play02:50

nossas análises de dados e fazer

play02:52

experimentos comprobatórios né pra

play02:55

avaliar

play02:56

e se de fato a minha com relação à la

play02:59

implica numa causalidade ou não e para

play03:01

colocar essas correlações né até mais é

play03:06

ilustrativas aí tem até um site né que

play03:08

ficou conhecido aí que é o site das

play03:10

correlações espúrias né é que traz

play03:13

vários dados que se correlacionam bem

play03:15

Absurdos como por exemplo a o número de

play03:18

pessoas que morreram Afogados na piscina

play03:20

com o número de filmes com Nicolas Cage

play03:22

aparece então tem a Anna a Anna nós que

play03:25

toda vez que o Nicolas Cage aparece né

play03:27

que aqui no caso da linha preta morre

play03:30

mais gente afogada na piscina né tá aqui

play03:32

uma prova Cabal de que o Nicolas Cage

play03:34

vendeu a alma para o capeta para ter

play03:37

sucesso e daí quando está no filme o

play03:39

capeta venha não tem nada a ver né É só

play03:42

uma coincidência né Às vezes tem até

play03:44

porque a gente tem uma palavra para

play03:45

descrever os tem outras correlações uma

play03:48

que eu gosto muito é sobre o preço do

play03:50

petróleo número de CDs de rock lançado

play03:53

né então na década de 70 pô Ele

play03:55

acreditou eu penso continuasse álbum de

play03:58

rock bom para cadernos Stones Beatles

play04:01

Led Zeppelin todo mundo começando lá né

play04:04

Não também tem nada a ver só uma

play04:06

coincidência Tudo bem então a gente tem

play04:08

essas correlações Então a gente tem que

play04:10

tomar muito cuidado é para analisar se

play04:13

as nossas relações são de fato relações

play04:15

causais ou seleção apenas coincidências

play04:17

do banco de dados ou dois eventos

play04:20

causados por um terceiro Beleza a gente

play04:22

tem que sempre somente com essa gente

play04:24

encerra a fase de análise né é de novo

play04:27

Lembrando que o mais importante dessa

play04:29

fase é você desenvolver as mudanças e

play04:31

como a gente viu lá nos Queijos nos

play04:33

exemplos é essas ferramentas eles são

play04:36

bem outras bem interessante traz na

play04:38

próxima fase Então a gente vai começar a

play04:41

falar dor implo até mais

Rate This

5.0 / 5 (0 votes)

Related Tags
Correlation vs CausationData AnalysisStatistical MisinterpretationRadio and Mental HealthWorld War INicolas CageSpurious CorrelationsData InterpretationCausality Assessment