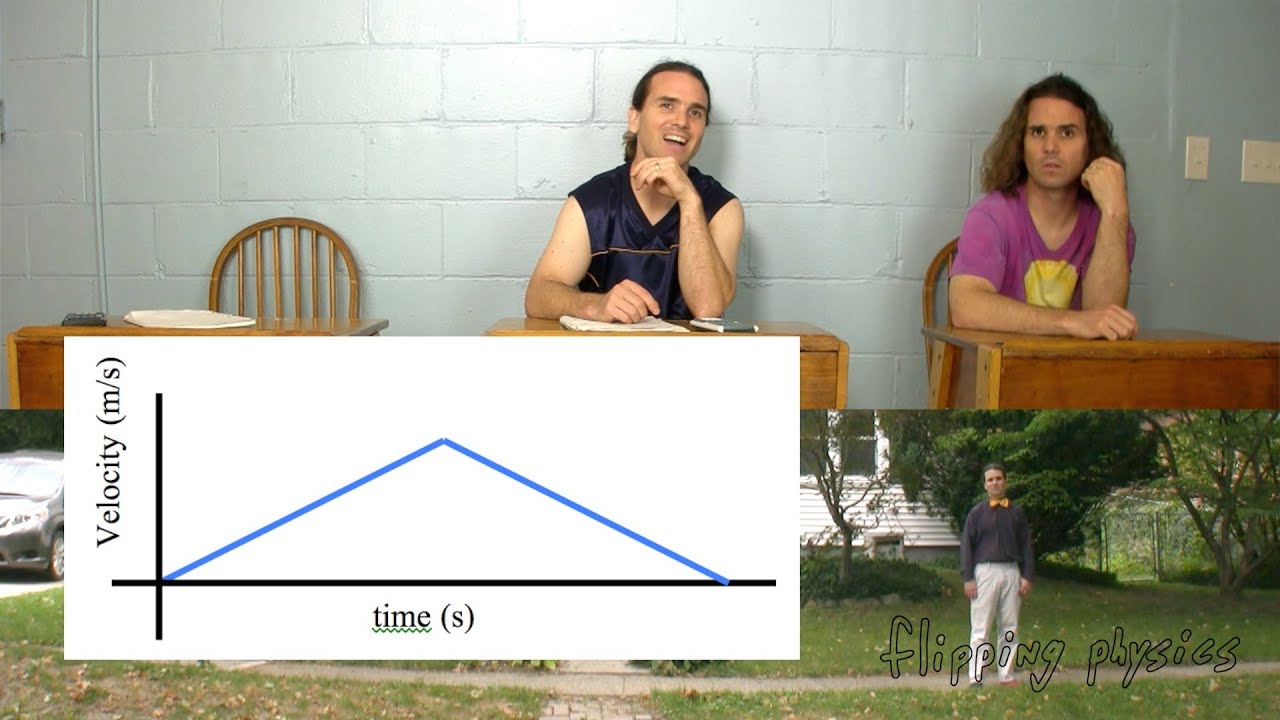
Velocity vs time graphs
Summary
TLDRThis educational video script explains the concept of velocity versus time graphs in physics. It uses the analogy of a 'moving man' to demonstrate how velocity is calculated as the change in position over time. The script guides viewers through constructing velocity versus time graphs for different scenarios, illustrating how to determine displacement by calculating the area under the curve. It also differentiates between average speed, which is total distance divided by time, and average velocity, which is displacement divided by time. The script aims to clarify these concepts with step-by-step examples.
Takeaways
- 📊 **Velocity vs. Time Graphs**: The lecture focuses on understanding velocity versus time graphs, which are used to analyze an object's motion by plotting velocity against time.
- 🧍 **Stationary Position**: When an object is stationary, the slope on a position versus time graph is zero, indicating a velocity of 0 meters per second.
- 🚶♂️ **Positive Direction Movement**: A positive slope on a position versus time graph signifies movement in the positive direction, corresponding to a positive velocity.
- 🔄 **Change in Direction**: The lecture discusses how a change in direction is represented by a negative slope, indicating the object is moving in the opposite direction with a negative velocity.
- ⏱️ **Velocity Calculation**: Velocity is calculated as the change in position over time, which can be determined from the slope of the graph.
- 📉 **Flat Lines on Graphs**: Flat lines on a velocity versus time graph indicate constant velocity, where the object is moving at a steady speed without acceleration.
- 🔢 **Displacement from Graphs**: The area under the velocity versus time graph can be used to calculate displacement, where the area represents the product of velocity and time.
- 📐 **Shading Technique**: Shading the area under the curve in a velocity versus time graph back to the zero velocity line helps in determining the displacement.
- 📝 **Graph Interpretation**: The lecture explains how to interpret different segments of the graph to find an object's velocity at specific times and how to sketch the corresponding position versus time graph.
- 📌 **Connecting Graphs to Motion**: The connection between velocity versus time graphs and position versus time graphs is emphasized, showing how they relate to the object's movement.
- 📋 **Total Distance and Displacement**: The lecture concludes with calculating total distance traveled and total displacement, highlighting the difference between speed (total distance divided by time) and velocity (displacement divided by time).
Q & A
What is the relationship between the slope of a position versus time graph and velocity?
-The slope of a position versus time graph represents velocity. A positive slope indicates a positive velocity (moving in the positive direction), a negative slope indicates a negative velocity (moving in the negative direction), and a zero slope indicates zero velocity (not moving).
How can you determine the velocity of an object from a velocity versus time graph?
-You can determine the velocity of an object from a velocity versus time graph by looking at the value of the graph at a specific time. If the graph is flat (zero slope), the velocity is constant and equal to the y-value of the flat line.
What does the area under a velocity versus time graph represent?
-The area under a velocity versus time graph represents the displacement of an object. This is because the area (velocity multiplied by time) gives you the change in position, which is displacement.
How do you calculate the total distance traveled from a velocity versus time graph?
-To calculate the total distance traveled from a velocity versus time graph, you find the area under the curve for each segment of motion and sum the absolute values of these areas, regardless of direction.
What is the difference between displacement and distance?
-Displacement is the change in position of an object and is a vector quantity, which means it has both magnitude and direction. Distance is the total path length traveled by an object and is a scalar quantity, meaning it only has magnitude and no specific direction.
How can you find the average speed over a time interval from a velocity versus time graph?
-To find the average speed over a time interval from a velocity versus time graph, you calculate the total distance traveled (sum of absolute areas under the curve) and divide it by the total time of travel.
How can you find the average velocity over a time interval from a velocity versus time graph?
-To find the average velocity over a time interval from a velocity versus time graph, you calculate the total displacement (sum of areas under the curve considering direction) and divide it by the total time of travel.
What does a flat line at the zero value on a velocity versus time graph indicate?
-A flat line at the zero value on a velocity versus time graph indicates that the object is at rest or not moving during that time interval.
How do you sketch a position versus time graph from a description of an object's motion?
-To sketch a position versus time graph from a description of an object's motion, you plot the object's position at various times along the x-axis (time) and the corresponding positions along the y-axis. Connect these points with lines to represent the object's motion over time.
What is the significance of the direction of velocity in a velocity versus time graph?
-The direction of velocity in a velocity versus time graph is significant because it indicates whether the object is moving in the positive or negative direction along the chosen axis. Positive velocity indicates motion in one direction, while negative velocity indicates motion in the opposite direction.
Outlines

This section is available to paid users only. Please upgrade to access this part.
Upgrade NowMindmap

This section is available to paid users only. Please upgrade to access this part.
Upgrade NowKeywords

This section is available to paid users only. Please upgrade to access this part.
Upgrade NowHighlights

This section is available to paid users only. Please upgrade to access this part.
Upgrade NowTranscripts

This section is available to paid users only. Please upgrade to access this part.
Upgrade NowBrowse More Related Video
Walking Position, Velocity and Acceleration as a Function of Time Graphs

Aprenda a LER um Gráfico de VELOCIDADE X TEMPO | CINEMÁTICA
Kinematics: Acceleration Vs Time Graph

IGCSE Physics [Syllabus 1.2] Motion

High School Physics: Graphing Motion

Le mouvement rectiligne uniformément accéléré (1/2) | Physique | Alloprof
5.0 / 5 (0 votes)