SPSS: Generating and Interpreting Descriptive Statistics - Part 1
Summary
TLDRIn this video, Jonathan Lambert from the National College of Ireland provides an overview of generating descriptive statistics in SPSS. He walks through the process using a dataset of 1,800 employees, discussing key variables like salary, age, and education. Jonathan demonstrates how to use SPSS to create graphical and numerical summaries, such as histograms and measures of central tendency and dispersion. He highlights the importance of understanding data distribution, the effects of skewness and outliers, and how to choose appropriate measures, like the median, when outliers are present.
Takeaways
- 📊 The video focuses on generating descriptive statistics in SPSS.
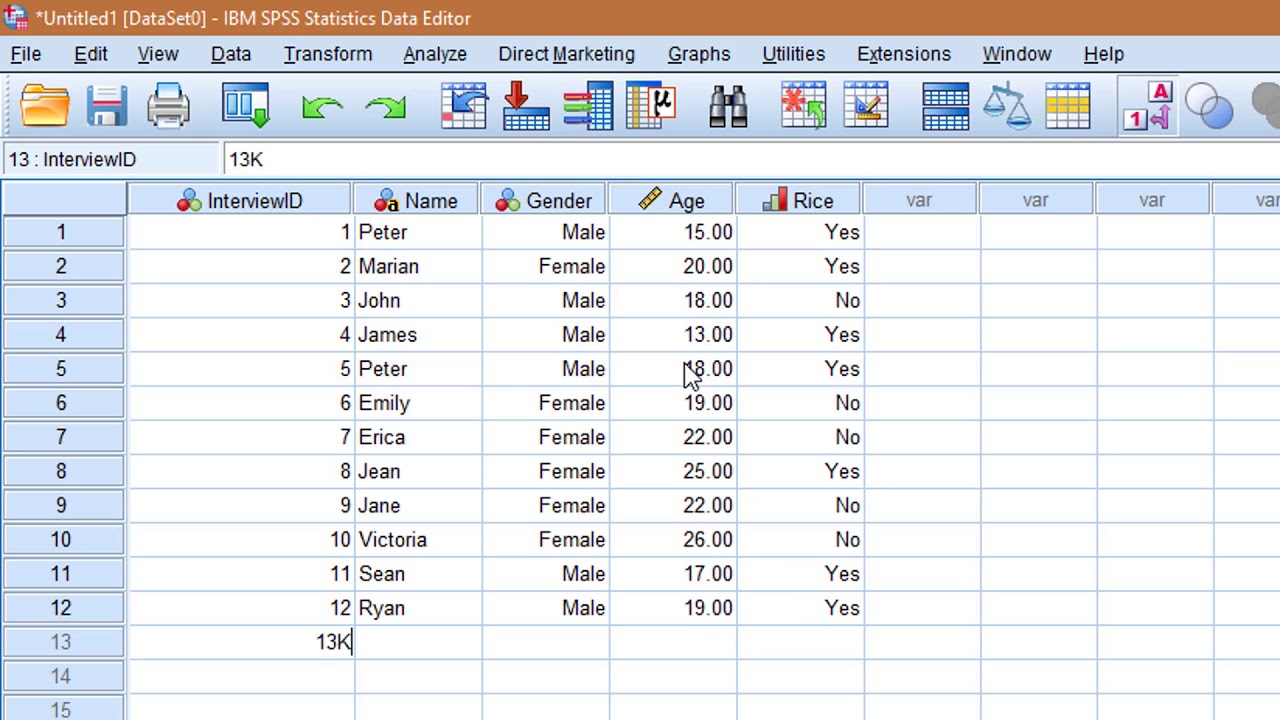
- 💻 The dataset includes profiles of 1,800 employees with various characteristics like employee number, gender, age, and salary.
- 👥 Variables in the dataset have been coded with appropriate scales of measurement, including nominal and ordinal scales.
- 🧮 The presenter demonstrates how to view the dataset using the 'variable view' and 'data view' windows in SPSS.
- 📈 The video briefly mentions generating graphical representations of data, such as bar charts, histograms, and scatter plots, to describe distributions.
- 📉 The focus shifts to the salary variable, with the goal of analyzing its distribution numerically.
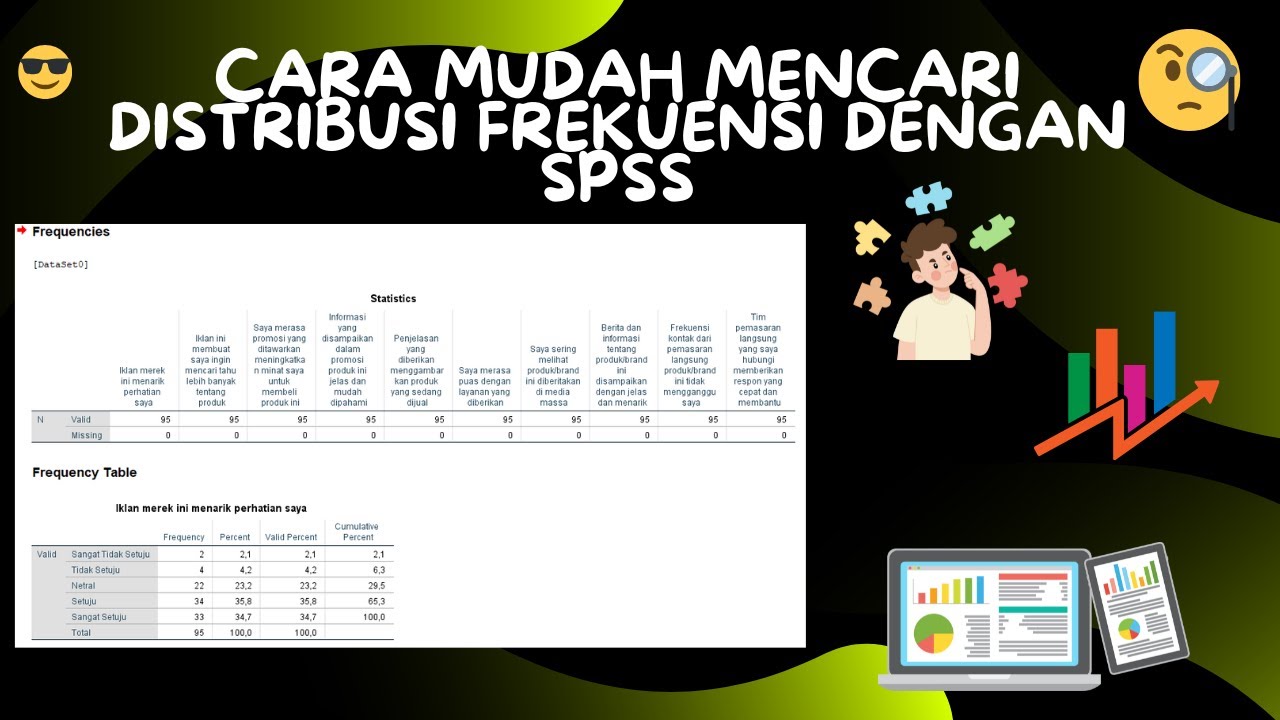
- 🔢 The presenter shows how to generate measures of central tendency (mean, median) and measures of dispersion (standard deviation, minimum, maximum) using the descriptive statistics function in SPSS.
- 🧮 The histogram of the salary variable reveals a positively skewed distribution, with some high outliers.
- 📉 The presenter explains that the mean can be affected by outliers and suggests that the median may be a more appropriate measure in this case.
- 📊 SPSS can generate descriptive statistics like mean, standard deviation, skewness, and kurtosis, but other statistics like the median may require different methods.
Q & A
What is the main focus of the video?
-The video focuses on generating descriptive statistics using SPSS, particularly analyzing a dataset to explore measures of central tendency and dispersion.
What dataset is being used in the video?
-The dataset contains information on 1,800 employees in an organization, with details such as employee number, gender, age, length of service, education level, pension membership, salary type, and various work-related metrics.
What does the variable 'employee number' represent?
-The 'employee number' variable represents a unique identifier for each employee in the dataset.
How are the variables in the dataset categorized?
-The variables are categorized based on scales of measurement such as nominal, ordinal, and continuous scales. For example, gender is coded nominally (0 for male, 1 for female), and education level is measured on an ordinal scale.
What are the main graphical methods previously used to describe the distributions of variables?
-The video mentions generating bar charts, histograms, scatter plots, box and whisker plots, and error bars to describe the distributions of variables.
Which variable is chosen for further analysis in the video?
-The 'salary' variable is chosen for further analysis, focusing on understanding its distribution.
What does the histogram of the salary variable reveal about its distribution?
-The histogram shows that the salary distribution is positively skewed, with three distinct clusters, and salaries ranging from under €19,000 to just under €100,000.
What are the key measures calculated using descriptive statistics for the salary variable?
-Key measures include the mean salary, standard deviation, minimum and maximum salary, skewness, and kurtosis.
Why is the mean not always an appropriate measure of central tendency for skewed distributions?
-The mean is susceptible to outliers, and in positively skewed distributions like this one, high outliers can pull the mean in their direction, making it less representative of the typical data point. The median is often a better measure in such cases.
What statistical analysis tool is used to generate descriptive statistics in the video?
-SPSS's 'Descriptives' function, accessed through the 'Analyze' menu, is used to generate descriptive statistics like the mean, standard deviation, minimum, and maximum values.
Outlines

This section is available to paid users only. Please upgrade to access this part.
Upgrade NowMindmap

This section is available to paid users only. Please upgrade to access this part.
Upgrade NowKeywords

This section is available to paid users only. Please upgrade to access this part.
Upgrade NowHighlights

This section is available to paid users only. Please upgrade to access this part.
Upgrade NowTranscripts

This section is available to paid users only. Please upgrade to access this part.
Upgrade NowBrowse More Related Video

5.0 / 5 (0 votes)