Google Sheets Charts Tutorial // How to create charts and graphs in Google Sheets
Summary
TLDRIn this tutorial by Loves Data, Benjamin teaches viewers how to create various charts and graphs in Google Sheets, including line, column, and pie charts. He demonstrates how to customize these visuals, add them to presentations and documents, and utilize the 'Explore' feature for data visualization suggestions. The video aims to help users effectively convey their data through clear and concise charts.
Takeaways
- 📊 **Creating Charts in Google Sheets**: Learn how to create various types of charts such as line, column, and pie charts in Google Sheets.
- 🔍 **Using 'Explore' Feature**: Discover the 'Explore' feature in Google Sheets for quick data visualization suggestions.
- 🎨 **Customizing Charts**: Customize your charts by changing titles, colors, line thickness, and adding data labels or trendlines.
- 🗂️ **Organizing with Dashboards**: Use the 'Move to own sheet' option to create a dedicated dashboard for all your charts in one place.
- 📈 **Visualizing Data Trends**: Utilize line charts to visualize trends over time, such as revenue by date.
- 📋 **Adjusting Axis Settings**: Modify horizontal and vertical axis titles, text colors, and set maximum values for better chart readability.
- 🖊️ **Editing Chart Elements**: Easily edit chart elements by double-clicking directly on the chart for quick access to customization options.
- 📊 **Pie and Donut Charts**: Create pie charts to show proportions, and explore variations like donut charts for a different visual style.
- 📝 **Adding Charts to Documents**: Embed charts into Google Docs by copying and pasting, with options to link or unlink the chart from the source spreadsheet.
- 🔗 **Updating Charts**: Ensure charts in documents and presentations stay up-to-date by linking them to the original spreadsheet.
- 💡 **Experiment with Chart Types**: Experiment with different chart types to find the best way to convey your data's story effectively.
Q & A
What is the main topic of the video by Benjamin from Loves Data?
-The main topic of the video is how to create charts and graphs in Google Sheets.
Which types of charts does Benjamin cover in the video?
-Benjamin covers line charts, column charts, and pie charts in the video.
How does the 'Explore' feature in Google Sheets help users?
-The 'Explore' feature in Google Sheets provides suggestions for visualizing data when users are unsure how to represent it.
What is the first step to create a line chart in Google Sheets as shown in the video?
-The first step to create a line chart is to select the cells for the chart, in this case, 'G2' to 'H7'.
How can viewers access Benjamin's 'Google Sheets Tutorial for Beginners'?
-Viewers can access the 'Google Sheets Tutorial for Beginners' by finding the link in the description below the video.
What customization options are available for the line chart in Google Sheets?
-Customization options for the line chart include changing the chart type, axis titles, series color and thickness, adding data labels, and including a trendline.
How can you move a chart to its own sheet in Google Sheets?
-You can move a chart to its own sheet by selecting the chart and then choosing 'Move to own sheet' from the options that appear when clicking the three vertical dots on the top right corner of the chart.
What does Benjamin suggest doing with charts once they are created?
-Benjamin suggests copying the charts and adding them to a 'Dashboard' sheet for organization.
How can you add a chart to a Google Slides presentation?
-You can add a chart to a Google Slides presentation by copying the chart from Google Sheets and pasting it into the presentation.
What is the benefit of linking a chart to a spreadsheet when pasting it into a document?
-Linking a chart to a spreadsheet ensures that the chart in the document updates automatically when changes are made to the spreadsheet.
What advice does Benjamin give for choosing the right chart in Google Sheets?
-Benjamin advises choosing a chart that is concise and easy to understand and using the 'Suggested' charts or 'Explore' feature if unsure.
Outlines

This section is available to paid users only. Please upgrade to access this part.
Upgrade NowMindmap

This section is available to paid users only. Please upgrade to access this part.
Upgrade NowKeywords

This section is available to paid users only. Please upgrade to access this part.
Upgrade NowHighlights

This section is available to paid users only. Please upgrade to access this part.
Upgrade NowTranscripts

This section is available to paid users only. Please upgrade to access this part.
Upgrade NowBrowse More Related Video
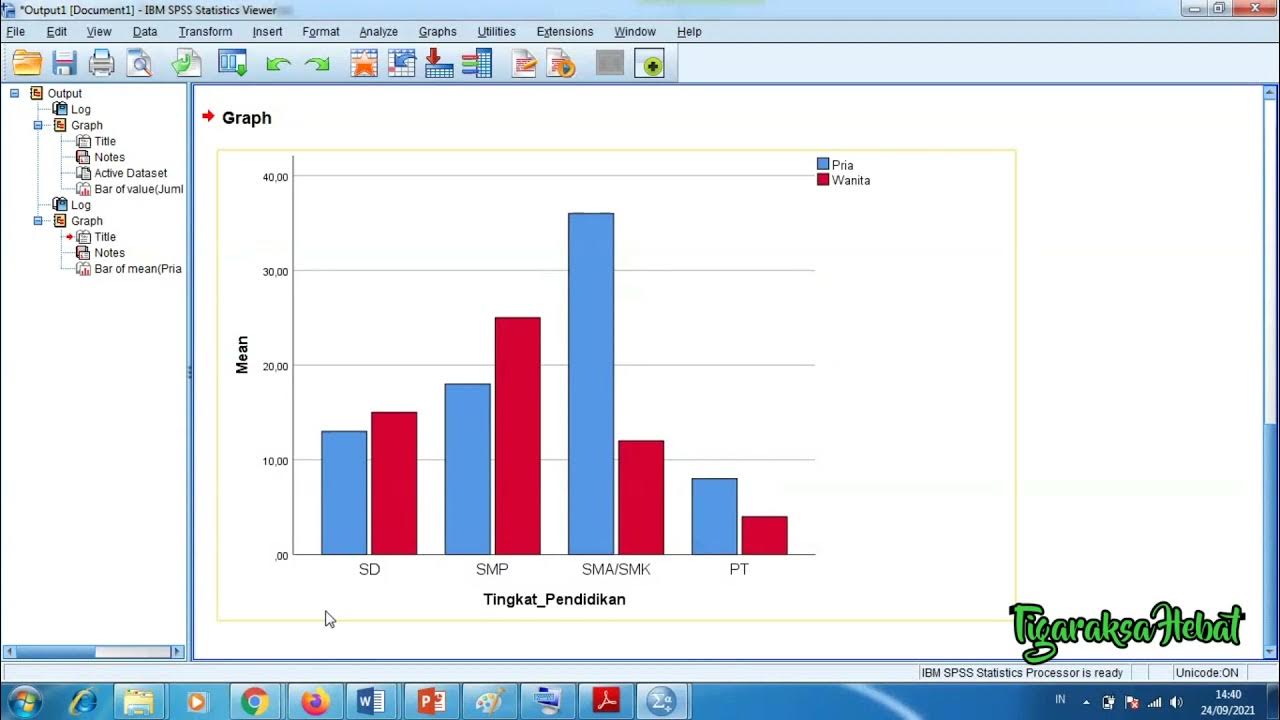
Penyajian Data Statistik Menggunakan SPSS
Cara Membuat Grafik di Excel Untuk Pemula

Visualisasi Data | Menyajikan Data dengan Grafik di Ms Excel | Materi Informatika Kelas 8

Matematika Kelas 7: Penyajian Data
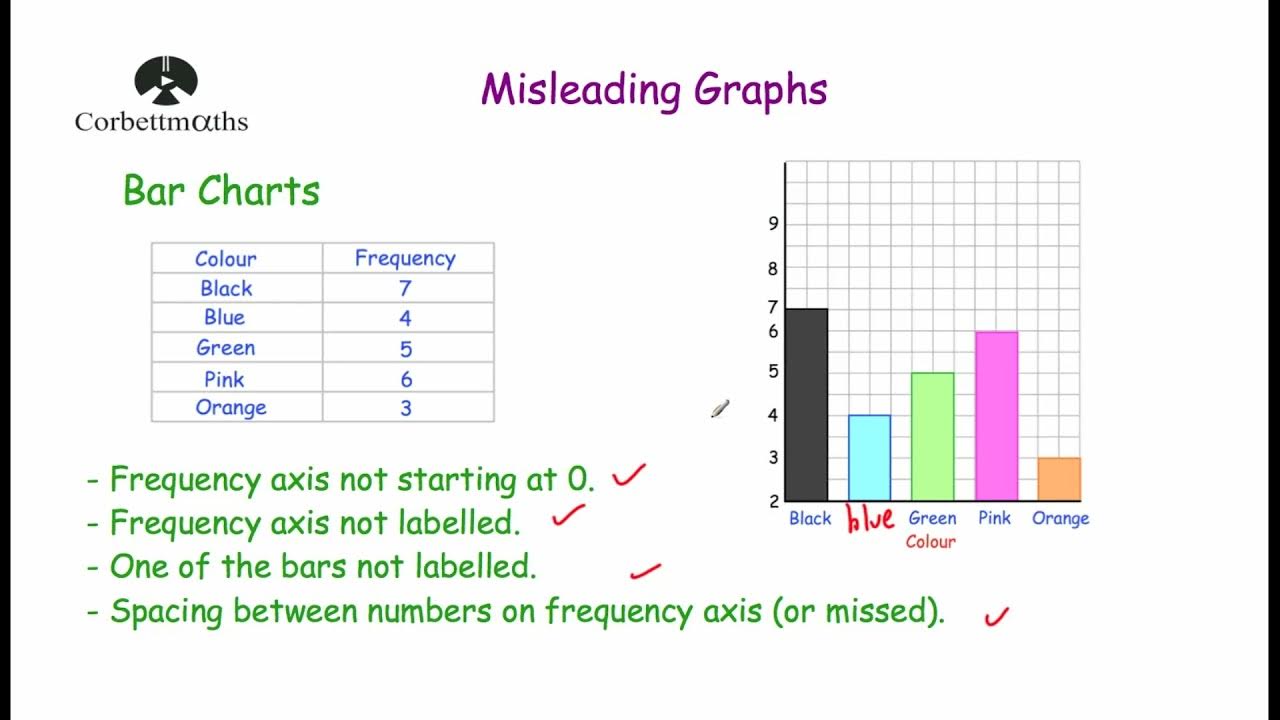
Misleading Graphs - Corbettmaths
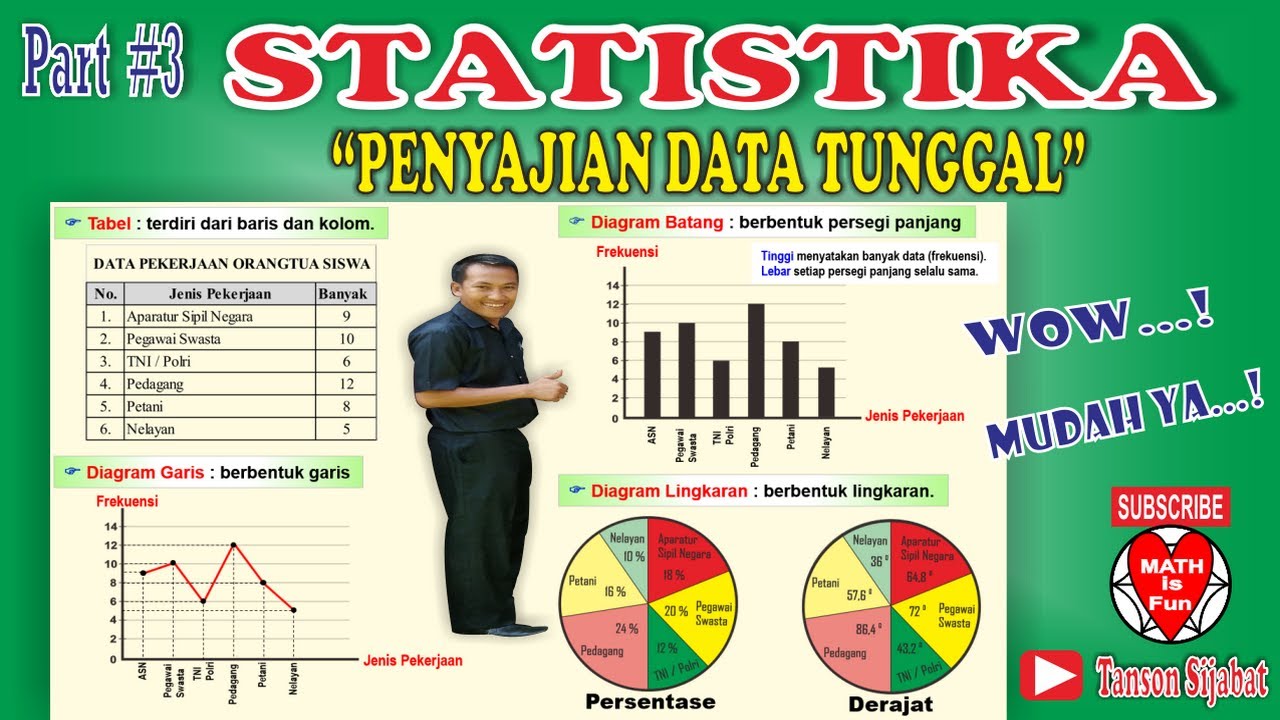
STATISTIKA | PENYAJIAN DATA TUNGGAL [Tabel, Diagram Garis, Diagram Batang, Lingkaran]
5.0 / 5 (0 votes)