GCSE Chemistry - How to Calculate the Rate of Reaction - Measuring Rate of Reaction #48

Cognito
4 Apr 201906:15

Summary

TLDRThis educational video explains how to use graphs to measure the mean and instantaneous rates of a chemical reaction. It demonstrates calculating average reaction rates over a period and determining rates at specific times by analyzing the gradient of the reaction curve. The example of magnesium and hydrochloric acid reaction is used to illustrate these concepts, showing how the rate changes from fast at the beginning to slow as the reaction progresses. The video reassures viewers that approximate tangent lines are acceptable for calculating reaction rates.

Takeaways

  • πŸ“Š The video explains how to use graphs to measure the mean rate of a chemical reaction and the rate at a specific time.
  • ⏱️ The rate of reaction is calculated by dividing the amount of reactants used or products formed by the time taken for the change.
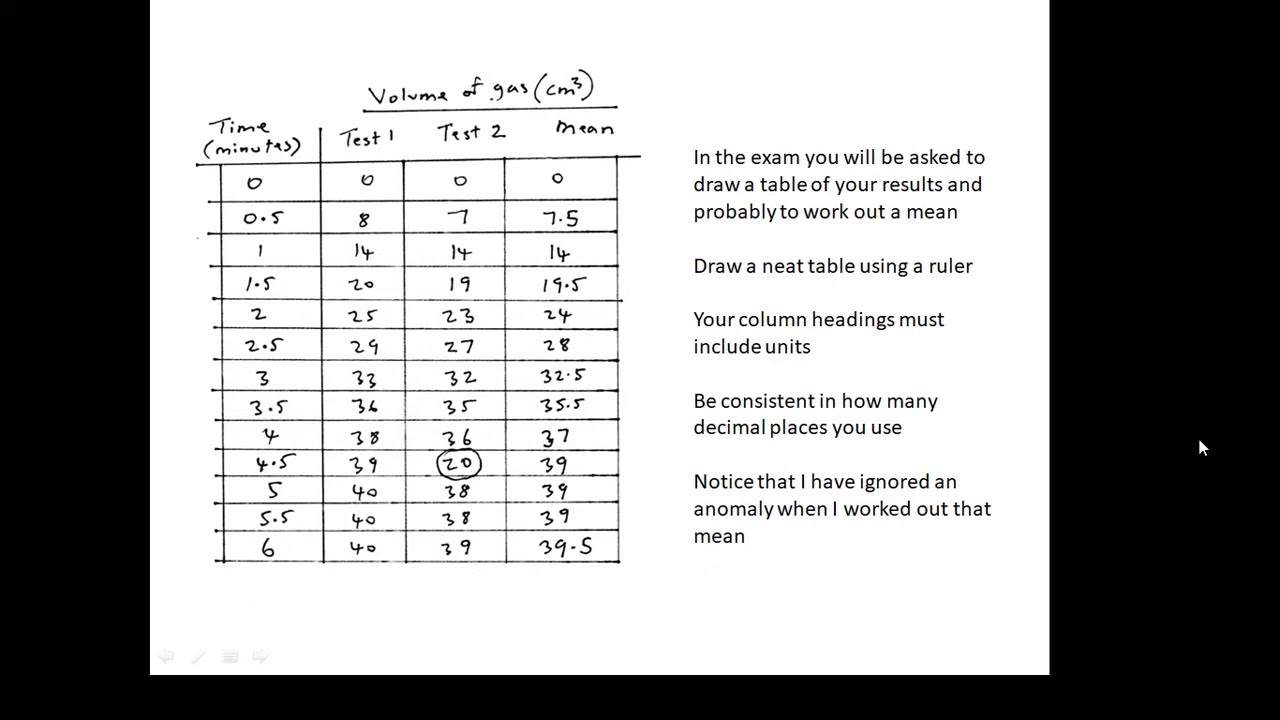
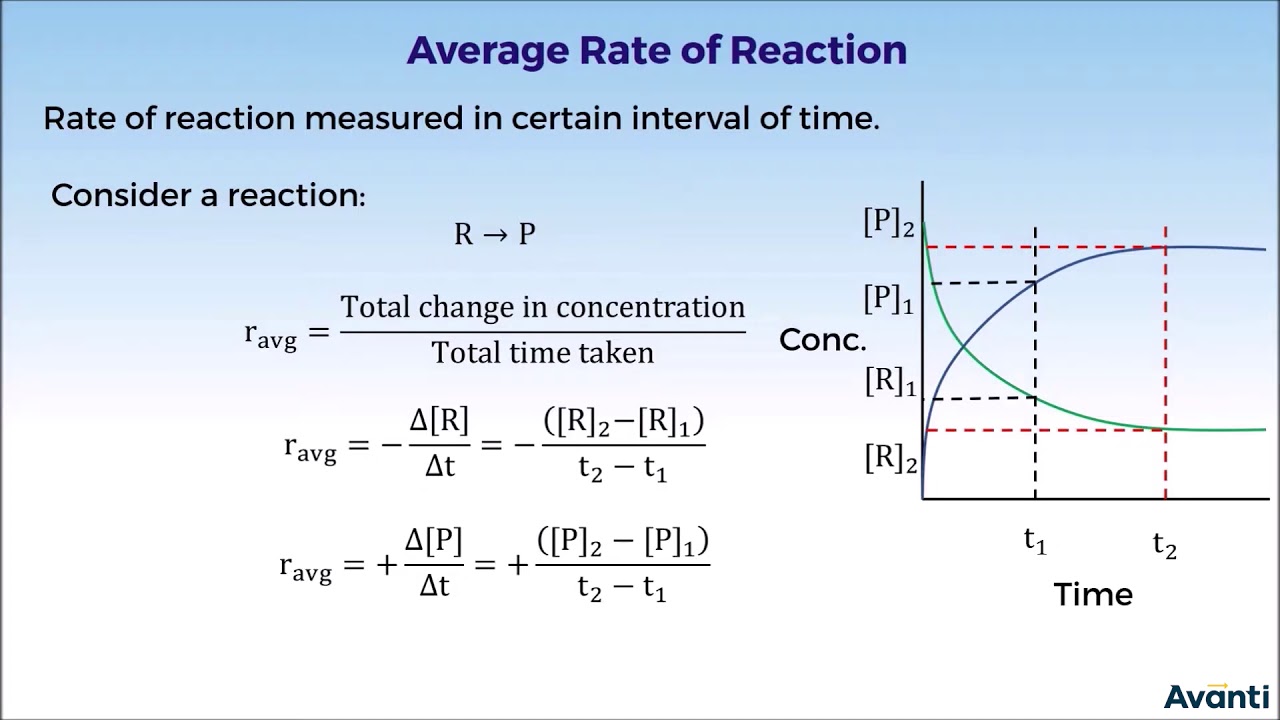
  • πŸ” A graph with time on the x-axis and volume of hydrogen on the y-axis can illustrate how the rate of reaction changes over time.
  • ➑️ Initially, the reaction rate is high, indicated by a steep curve, and slows down as reactants are consumed, eventually plateauing.
  • πŸ“‰ To find the mean rate over a period, calculate the volume of hydrogen produced during that time and divide by the time in seconds.
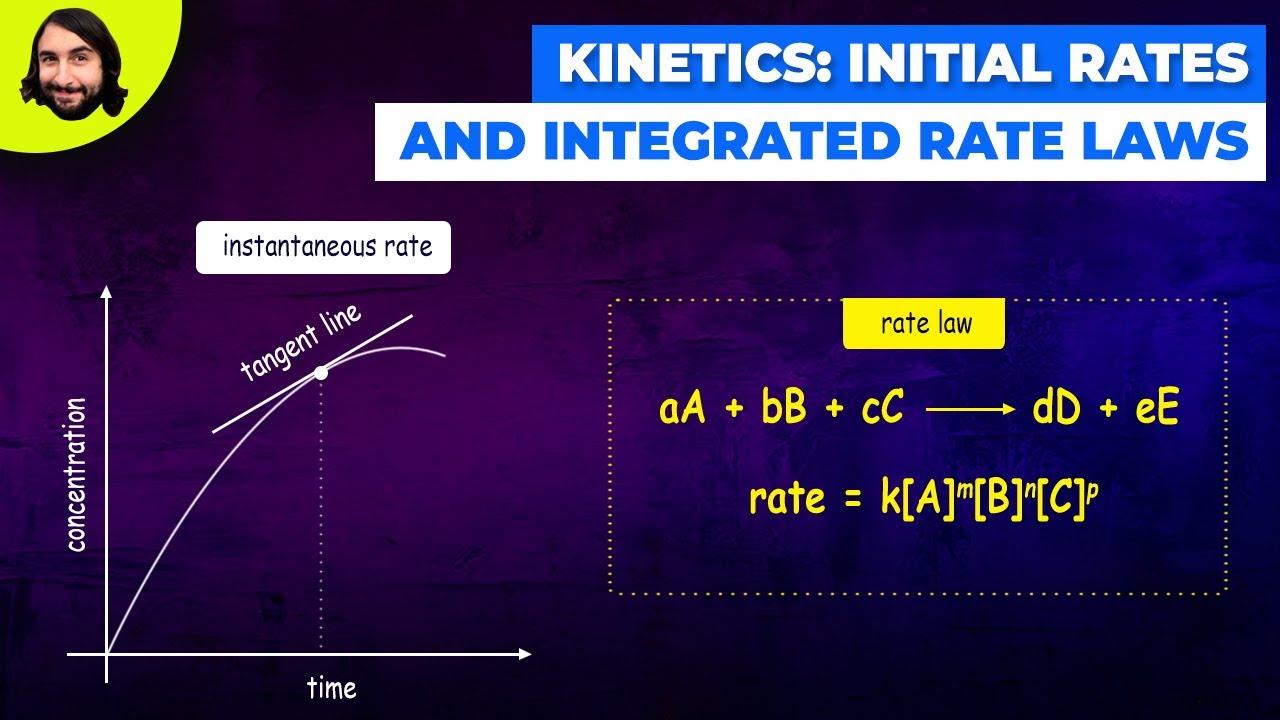
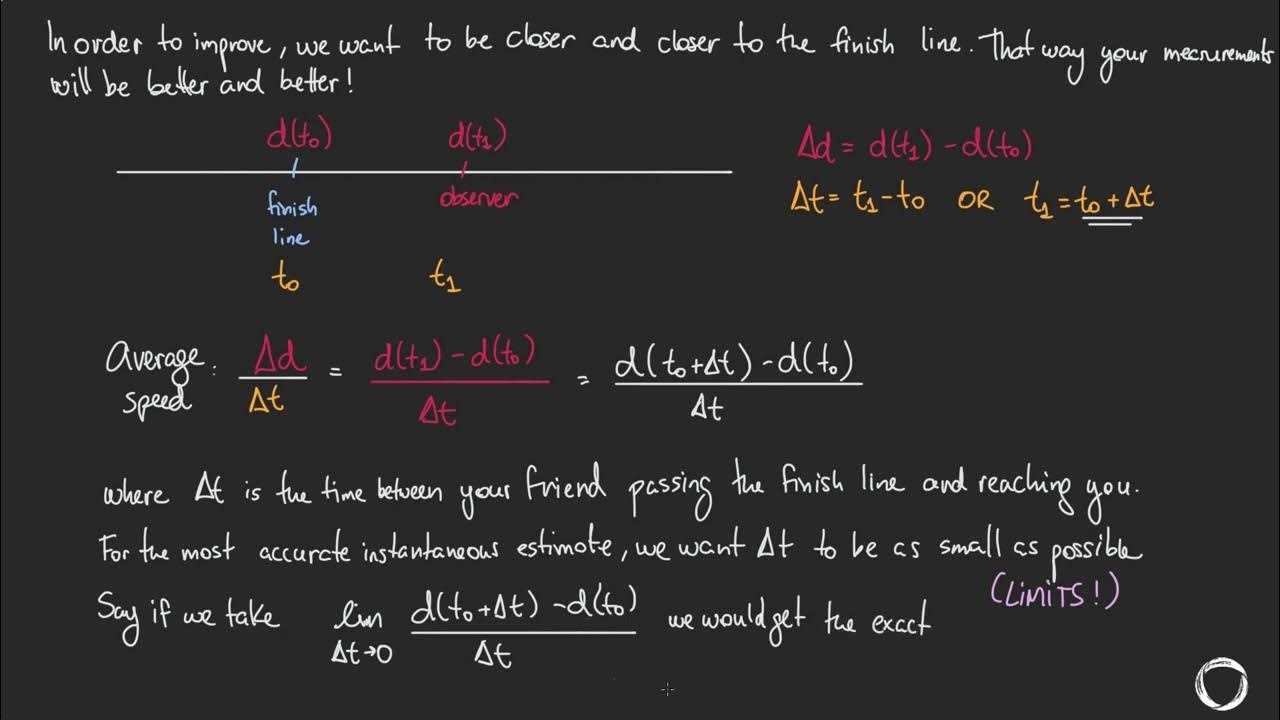
  • πŸ“ˆ The gradient of the curve at a specific time point represents the instantaneous rate of reaction at that time.
  • πŸ“ To calculate the rate at a specific time, draw a tangent to the curve at the corresponding x-axis value and find its gradient.
  • πŸ” The gradient is found by the change in volume (y-axis) divided by the change in time (x-axis), with the tangent line extended to intersect the axes.
  • πŸ”¬ The video also mentions that the same method can be applied to a graph plotting the amount of magnesium remaining against time.
  • βš–οΈ For a magnesium graph, the rate of reaction is calculated by the change in magnesium weight divided by the change in time, reflecting the reaction's progress.

Q & A

  • How is the rate of reaction calculated in the context of the video?

    -The rate of reaction is calculated by dividing the amount of reactants used or the amount of product formed over the time taken for that change to occur.

  • What is the difference between the average rate and the instantaneous rate of a reaction?

    -The average rate is calculated over a period of time, giving a general idea of how fast the reaction is proceeding, while the instantaneous rate is the rate at a specific moment in time, which can be determined by the slope of the curve on a graph at that point.

  • Why does the rate of reaction typically slow down as the reaction progresses?

    -The rate of reaction slows down because as the reaction progresses, the concentration of reactants decreases, leading to fewer effective collisions between reactant particles.

  • How can you determine the mean rate of reaction over a specific period using a graph?

    -To determine the mean rate of reaction over a specific period, you find the volume of product formed during that period on the graph, and then divide that volume by the time interval.

  • What does a steep curve on a graph of reaction rate versus time indicate?

    -A steep curve on a graph of reaction rate versus time indicates a high rate of reaction, suggesting that a large amount of product is being formed in a short period of time.

  • How do you calculate the rate of reaction at a specific time using a graph?

    -To calculate the rate of reaction at a specific time, you draw a tangent to the curve at the corresponding time on the x-axis, then determine the gradient of this tangent, which is the change in volume of product divided by the change in time.

  • Why is it important to make the tangent as long as possible when calculating the instantaneous rate?

    -Making the tangent as long as possible helps to minimize the error in estimating the gradient, as it allows for a more accurate measurement of the change in y and x values.

  • What is the significance of a graph plateauing in the context of a reaction rate graph?

    -A graph plateauing indicates that the reaction has completed, and no more product is being formed, suggesting that all the reactants have been consumed.

  • Can the method described in the video be applied to reactants as well as products?

    -Yes, the method can be applied to reactants as well. You can plot the amount of a reactant remaining against time and use a similar approach to determine the rate of reaction.

  • How does the examiner's tolerance for the accuracy of tangents affect the calculation of the rate of reaction?

    -The examiner's tolerance for the accuracy of tangents allows for a range of values in the calculation, meaning that while it's important to be careful, slight variations in the tangent's placement won't significantly affect the final rate calculation.

Outlines

00:00

πŸ“Š Understanding Reaction Rates Through Graphs

This paragraph introduces the concept of using graphs to measure the mean and instantaneous rates of a chemical reaction. It explains that while the average rate of reaction can be calculated by dividing the amount of reactants used or products formed by the time taken, this method only provides an average rate and does not reflect the actual rate changes throughout the reaction. The paragraph then describes how plotting the volume of hydrogen produced against time on a graph can help visualize the rate of reaction changes. Initially, the curve is steep, indicating a high rate due to abundant reactants, but as the reaction progresses, the curve flattens as the reaction slows down. The paragraph also discusses how to calculate the mean rate over a specific period using the graph and how to determine the instantaneous rate at a particular time by drawing a tangent to the curve at that point.

05:01

πŸ” Calculating Instantaneous Reaction Rates

Paragraph 2 delves deeper into the process of calculating the instantaneous rate of a reaction at a specific time by using a graph that plots the amount of a reactant, such as magnesium, against time. It illustrates the method by showing how to find the rate at one minute by drawing a tangent to the curve at that time point. The tangent's gradient is determined by calculating the change in the y-axis (mass of magnesium) and the x-axis (time), resulting in the rate of reaction. The paragraph reassures that slight variations in the tangent's steepness are acceptable as long as the overall trend is consistent, leading to an accurate rate calculation. It concludes with a call to action for viewers to like and subscribe for more content.

Mindmap

Keywords

πŸ’‘Graphs

Graphs are visual representations of data, used in the video to illustrate how the rate of a chemical reaction changes over time. They are a fundamental tool in chemistry for analyzing reaction kinetics. In the script, graphs are used to plot the volume of hydrogen produced against time, allowing viewers to visually grasp the concept of reaction rates and how they vary.

πŸ’‘Mean Rate of Reaction

The mean rate of reaction is the average speed at which a reaction occurs over a specific time period. It is calculated by dividing the change in concentration of reactants or products by the time interval. The video explains how to determine the mean rate by using the graph to find the volume of hydrogen produced in the first three minutes and then dividing by the total time.

πŸ’‘Rate of Reaction

The rate of reaction refers to how quickly reactants are converted into products in a chemical process. It is a critical concept in understanding chemical kinetics. The video demonstrates how to calculate the rate of reaction at a specific time by finding the gradient of the curve on the graph, which represents the instantaneous rate at that point.

πŸ’‘M magnesium and Hydrochloric Acid

Magnesium and hydrochloric acid are the reactants in the chemical reaction example provided in the video. Their interaction produces hydrogen gas, which is used to demonstrate how to measure reaction rates. The script describes a scenario where magnesium reacts with hydrochloric acid to produce hydrogen, and the volume of this gas is used to plot the reaction rate on a graph.

πŸ’‘Volume of Hydrogen

In the context of the video, the volume of hydrogen produced is a measure used to track the progress of the chemical reaction between magnesium and hydrochloric acid. The volume is plotted on the y-axis of the graph, with time on the x-axis, to visualize the reaction rate over time.

πŸ’‘Time

Time is a crucial variable in the study of reaction rates, as it allows chemists to measure how quickly reactions occur. In the video, time is represented on the x-axis of the graph and is used to calculate both the mean and instantaneous rates of reaction.

πŸ’‘Instantaneous Rate

The instantaneous rate is the rate of reaction at a particular moment in time, as opposed to the average rate over a period. The video explains how to determine this by drawing a tangent to the curve on the graph at a specific time point, such as two minutes, and calculating its gradient.

πŸ’‘Gradient

In the context of the video, the gradient of a curve on a graph represents the rate of change at a specific point. It is calculated as the change in the dependent variable (volume of hydrogen) divided by the change in the independent variable (time). The script uses the gradient to find the instantaneous rate of reaction at a particular time.

πŸ’‘Tangent

A tangent is a straight line that touches a curve at a single point and has the same slope as the curve at that point. In the video, drawing a tangent to the curve on the graph at a specific time is used to determine the instantaneous rate of reaction by calculating the gradient of the tangent.

πŸ’‘Reaction Progress

Reaction progress refers to the extent to which a chemical reaction has proceeded over time. The video uses the concept to explain how the rate of reaction typically decreases as the reaction progresses, as depicted by the curve on the graph becoming less steep as time goes on.

πŸ’‘Plateau

A plateau on a graph indicates a period where there is little to no change in the variable being measured. In the video, the plateau in the graph signifies that all of the magnesium has reacted, and no more hydrogen is being produced, indicating the end of the reaction.

Highlights

Graphs can be used to measure the mean rate of a reaction and the rate at a specific time.

The rate of reaction is calculated by dividing the amount of reactants used or products formed over time.

The average rate during a set period can be found using the total volume of gas produced and the time taken.

Reactions typically start fast and slow down as they progress due to the depletion of reactants.

A graph with time on the x-axis and volume of hydrogen on the y-axis can show how the rate of reaction changes over time.

A steep curve on the graph indicates a high rate of reaction at the beginning of the reaction.

The graph plateaus when all the magnesium has been used up, indicating the reaction has finished.

The mean rate of reaction over a certain period can be calculated using the graph.

To find the mean rate, measure the volume of hydrogen produced in a specific time frame and divide by the time.

The rate of reaction at a particular time is found by calculating the gradient of the curve at that point.

A tangent to the curve at a specific time point represents the instantaneous rate of reaction.

The gradient of the tangent line is calculated by the change in volume divided by the change in time.

To improve accuracy, make the tangent line as long as possible and extend it to intersect an axis.

Estimations of tangents are acceptable as long as they are reasonably close to the curve.

The same method can be applied to a graph plotting the amount of magnesium remaining against time.

The rate of reaction can be determined at any time by drawing a tangent and calculating its gradient.

The video concludes with an invitation for viewers to like and subscribe for more content.

Transcripts

play00:03

in today's video we're going to see how

play00:05

we can use graphs to measure the mean

play00:07

rate of a reaction

play00:09

and the rate of reaction at a specific

play00:11

time

play00:13

we saw in the previous video that we can

play00:15

calculate the rate of reaction by

play00:17

dividing either the amount of reactants

play00:20

used

play00:20

or the amount of product formed over the

play00:23

time taken for that change to occur

play00:27

for example if this reaction between

play00:29

magnesium and hydrochloric acid produced

play00:31

to 1200 centimeters cubed of hydrogen in

play00:34

four minutes

play00:36

then our rate would be equal to 1200

play00:38

over 4 times 60

play00:41

or

play00:42

240 so be five centimeters cubed per

play00:46

second

play00:48

the problem with this type of

play00:50

calculation though

play00:51

is that it only gives us the average

play00:53

rate during those four minutes

play00:55

whereas in reality the reaction would

play00:57

have been fastest at the beginning and

play01:00

then it would have slowed down as the

play01:01

reaction progressed

play01:03

and by four minutes it might have even

play01:05

finished

play01:09

if we had a way to monitor how much gas

play01:11

was being released during the reaction

play01:12

though then we could plot it on a graph

play01:15

and see how the rate of reaction changes

play01:17

during the reaction

play01:19

on the x-axis we'd have time

play01:22

and on the y-axis we'd have the volume

play01:24

of hydrogen produced

play01:27

at first because there'll be loads of

play01:29

magnesium and acid that can react

play01:30

together loads of hydrogen will be

play01:32

produced

play01:33

so we get a very steep curve which

play01:35

indicates a high rate of reaction

play01:39

as the magnesium starts to get used up

play01:41

though the hydrogen will be produced

play01:43

more slowly

play01:44

until finally the graph plateaus

play01:47

once all of the magnesium has been used

play01:49

up

play01:51

with a graph like this there are two

play01:53

main things that you could be asked to

play01:54

do

play01:56

one is to calculate the mean rate of the

play01:58

reaction over a certain period

play02:00

which is what we did earlier

play02:03

for example what is the mean rate of

play02:05

reaction in the first three minutes

play02:08

for this we just need to use our graph

play02:10

to find out how much hydrogen was

play02:12

produced in those first three minutes

play02:15

so we find three minutes on the x-axis

play02:18

and then draw up a dashed line to see

play02:20

where it intersects our curve

play02:23

then we draw another line from this

play02:24

point across to the y axis to find that

play02:27

1200 centimeters cubed of hydrogen was

play02:29

produced

play02:31

so we just do 1200 centimeters cubed

play02:34

divided by 3 minutes or 180 seconds

play02:38

to get an average rate of 6.67

play02:41

centimeters cubed per second

play02:46

the other thing you could be asked

play02:47

though is to calculate the actual rate

play02:50

at a particular time

play02:52

for example what is the rate of reaction

play02:54

at two minutes

play02:57

to do this we need to calculate the

play02:59

gradient of the curve at that particular

play03:00

point

play03:02

so the first step is still to find two

play03:04

minutes on the x-axis

play03:06

and trace up to find where it intersects

play03:08

our curve

play03:09

but then instead of drawing a line

play03:11

across to the y-axis like we did before

play03:14

we instead draw a tangent to the curve

play03:16

at that point and remember a tangent is

play03:19

just a straight line that just touches

play03:21

the curve and has the same gradient as

play03:23

the curve does at that point

play03:27

once we have our tangents drawn we need

play03:29

to find the gradient of the line which

play03:31

is equal to the change in y

play03:33

divided by the change in x

play03:36

which in our case would be the change in

play03:38

the volume of hydrogen divided by the

play03:40

change in the time

play03:43

the best way to do this is to make your

play03:45

line as long as possible so that it hits

play03:47

one of the axes

play03:50

and then trace lines from the other end

play03:52

of your tangent to the y-axis

play03:54

and then to the x-axis

play03:58

so now this section here would be the

play04:00

change in the hydrogen which is about

play04:02

600

play04:03

and this section here would be the

play04:05

change in time which is about 2 minutes

play04:08

50 seconds

play04:09

or 170 seconds

play04:13

so we just do 600 divided by 170

play04:17

to give us 3.53 centimeters cubed per

play04:21

second as our rate

play04:24

just in case you're worrying about your

play04:25

tangents the examiners know that you're

play04:27

judging it by eye so they'll allow

play04:29

answers within a small range of values

play04:32

so even though you should be careful and

play04:34

try to get as close as you can you don't

play04:36

have to worry about getting it perfect

play04:41

before we finish i just want to point

play04:43

out that we could also have done the

play04:44

same thing with a graph that plotted the

play04:47

amount of magnesium remaining against

play04:49

timer

play04:51

this time though the graph would have

play04:52

started with however many grams we used

play04:55

in our reaction

play04:56

so in this case 1.2 grams

play04:58

and then would have declined rapidly at

play05:00

first but then more slowly

play05:05

so if we wanted to find the rate of

play05:07

reaction at one minute which just do the

play05:10

same process as before

play05:12

so we'd find the one minute points on

play05:14

our curve

play05:15

draw a tangent at that point

play05:18

and use that line to figure out our

play05:20

change in y

play05:22

which is about 0.72 grams

play05:25

and our change in x

play05:27

which is one minute 40 seconds

play05:30

and finally which divide our change in y

play05:32

by our change in x

play05:34

so 0.72 divided by 1 minute 40 or 100

play05:39

seconds

play05:41

to find our rate of

play05:43

0.0072 grams per second

play05:47

and if you made your tangent a bit

play05:49

longer or a bit shorter to use different

play05:52

y and x values that's absolutely fine

play05:55

as long as your tangent is just as steep

play05:57

as i was you would end up getting the

play05:58

same answer

play06:03

anyway that's all for today so if you

play06:05

enjoyed it then please do give us a like

play06:07

and subscribe

play06:08

and we'll see you next time

Rate This
β˜…
β˜…
β˜…
β˜…
β˜…

5.0 / 5 (0 votes)

Related Tags
ChemistryReaction RatesGraph AnalysisEducational VideoMg & HCl ReactionMean RateTangent MethodScience LearningExperimental DataChemical Kinetics