The Exact Strategy I Used To Go From BROKE To $500,000 In 9 MONTHS | FX Carlos
Summary
TLDRThis video outlines a trader's journey from zero to over $500k in just nine months, attributing success to a unique supply and demand trading strategy. The presenter simplifies market movements, explaining supply zones as selling points and demand zones as buying points. They emphasize the importance of identifying gaps in the market, which always get filled, and using breaker structures to confirm market direction. The strategy is detailed with practical examples, and the video concludes with a teaser for a comprehensive course that promises to further increase win rates and accelerate financial success.
Takeaways
- π The speaker shares a personal success story, going from $0 to over $500k in 9 months using a specific trading strategy.
- π The core strategy revolves around 'supply and demand trading', which the speaker claims to have refined into a life-changing method.
- π The speaker emphasizes the importance of identifying supply and demand zones on trading charts, which represent areas of significant market activity.
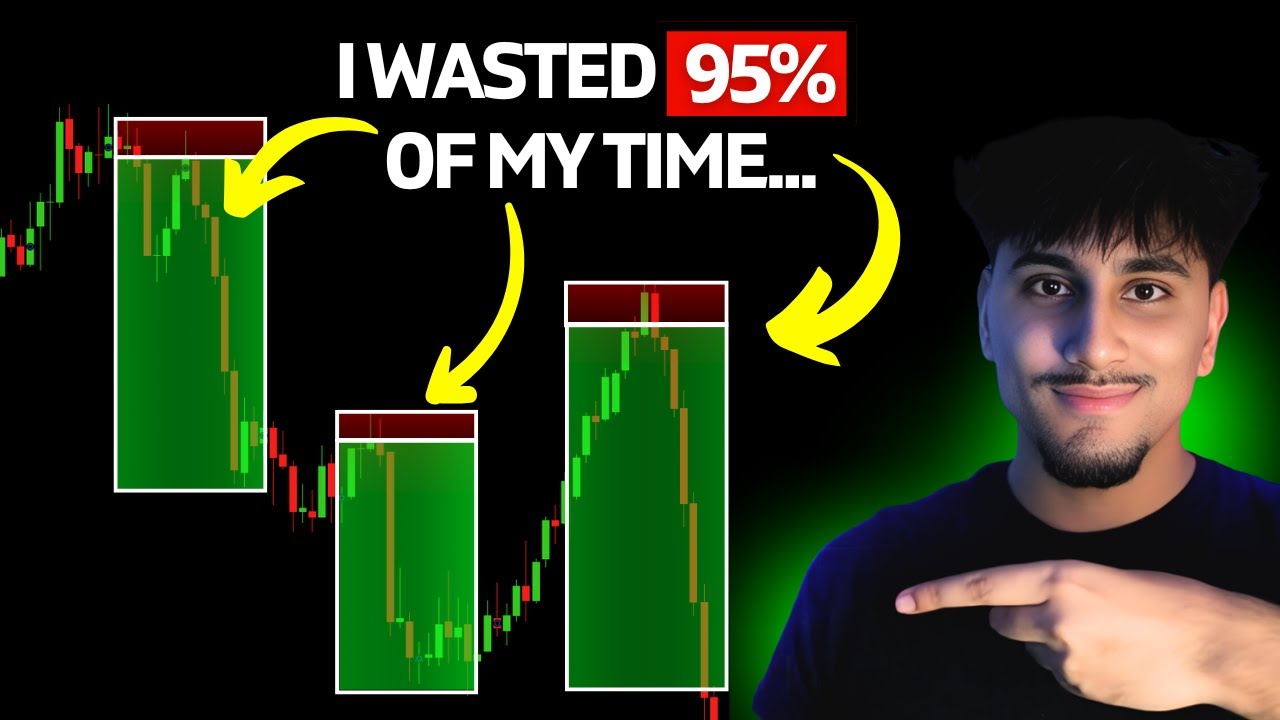
- π Supply zones are characterized by strong selling pressure, indicated by large red candles, while demand zones show buying pressure with large green candles.
- πΉ The speaker discusses the significance of 'gaps' in the market, which are price levels that must be filled according to market rules.
- π The concept of 'breaker structures' is introduced as a way to confirm market direction, indicating a potential change in trend.
- π The speaker provides a practical guide on how to identify and utilize supply and demand zones, gaps, and breaker structures in trading decisions.
- πΌ A trading tool called 'Kill zones' is mentioned, which helps traders determine the optimal times to look for trading opportunities.
- π The speaker claims that by applying this strategy with a high risk-to-reward ratio, it's possible to achieve significant financial success, as evidenced by their own experience.
- π For further insights and to increase win rates, the speaker suggests joining their course and participating in live trading sessions.
Q & A
What is the main strategy discussed in the video?
-The main strategy discussed in the video is supply and demand trading, which the speaker claims to have used to go from $0 to over 500k in just 9 months.
How does the speaker define supply and demand zones in the context of trading?
-In the context of trading, supply zones are areas where there are sales and demand zones are areas where there are buys. The speaker simplifies it by stating that supply is another word for sells and demand is another word for buys.
What is the significance of a 'demand push' or 'supply push' in the strategy?
-A 'demand push' or 'supply push' signifies a large amount of liquidity being pumped into the market by banks and liquidity providers, which often results in a significant price movement in the direction of the push.
How does the speaker identify gaps in the market?
-Gaps in the market are identified when the wicks of consecutive candles do not touch each other. The speaker emphasizes that these gaps must be filled at some point, and this can be used as a trading signal.
What is a breaker structure, and why is it important in the strategy?
-A breaker structure is a pattern that indicates a potential change in market direction. It is important because it provides confirmation of the market's intended direction, which helps in making more informed trading decisions.
What is the significance of the 'kill zones' indicator mentioned in the video?
-The 'kill zones' indicator is used to identify the optimal trading times, specifically the New York session according to the speaker. It helps to filter out trades and focus on the most active and potentially profitable trading times.
How does the speaker suggest determining the size of the risk and reward for a trade?
-The speaker suggests using a minimum risk-to-reward ratio of 1:3, meaning for every dollar risked, the potential reward should be three dollars. This high-risk, high-reward strategy is intended to ensure that even with losses, the trader can still be profitable in the long run.
What does the speaker mean by 'building a story' before entering a trade?
-By 'building a story,' the speaker means gathering multiple confluences or indicators that support a trade setup. This could include supply and demand zones, gaps, breaker structures, and other technical analysis tools to increase the confidence in the trade.
Why does the speaker recommend trading during the New York session?
-The speaker recommends trading during the New York session because it is considered the most active and liquid session, which can lead to more reliable trading signals and potentially higher profits.
What additional tools or strategies does the speaker mention are available to course members?
-The speaker mentions that there are additional tools and strategies that can increase the win rate and help traders reach their goals faster, but these are reserved for course members and not disclosed in the video.
Outlines
πΉ Introduction to Supply and Demand Trading Strategy
The speaker shares their personal financial journey, highlighting a significant transformation from living with parents to achieving financial success, including living in an upscale neighborhood, traveling, and driving luxury cars. This success is attributed to a unique supply and demand trading strategy in the Forex market. The speaker emphasizes that while many teach supply and demand, their method is distinctive and life-changing. They mention their students' successes and encourage viewers to learn this strategy by the end of the video. The speaker also promotes Forex trading tools and mentions various trading styles, asserting that their strategy is superior for long-term success.
π Understanding Supply and Demand Zones in Forex
The speaker simplifies the concept of supply and demand in trading, explaining that supply zones indicate selling pressure and demand zones suggest buying pressure. They use the Euro USD chart as an example to illustrate how strong supply or demand pushes, characterized by significant liquidity injections, can be identified. The speaker advises viewers to enter trades when the market returns to these levels, as banks are likely to trade there. They also discuss the importance of recognizing supply and demand zones, which are often marked by large candles, and how these zones canι’η€Ίη market movements.
π Identifying Gaps in the Market and Their Significance
The speaker introduces the concept of market gaps, which are price spaces between candles that need to be filled. They explain that gaps occur when the wicks of consecutive candles do not touch, creating a gap that the market will eventually fill. Using various examples, the speaker demonstrates how gaps are consistently filled, sometimes immediately and other times over weeks. They stress the importance of gaps in trading, as they provide a high level of confidence in predicting price movements. The speaker also discusses how to identify gaps and use them to build a trading strategy with multiple confluences, increasing the chances of successful trades.
π Breaker Structures and Combining Trading Confluences
The speaker discusses breaker structures, which are crucial for determining the market's direction. They explain how to identify higher highs and higher lows, as well as lower lows and lower highs, to understand the market's trend. Breaker structures are significant when the market breaks a trend, indicating a potential change in direction. The speaker provides examples of bullish and bearish breaker structures and how they signal a trend change. They also introduce the 'kill zones' indicator, which helps identify the best times to look for trades, specifically during the New York session. The speaker concludes by advising viewers to combine supply and demand zones, gaps, and breaker structures to form a comprehensive trading strategy.
π Executing the Strategy for High Risk-Reward Trades
The speaker demonstrates how to execute the trading strategy by identifying supply or demand zones, looking for gaps, and confirming them with horizontal lines. They explain the importance of drawing supply zones from the start of the gap to the swing high and entering trades when the price taps the box. The speaker emphasizes setting stop losses at the swing high to minimize risk and targeting a minimum risk-reward ratio of 1:3. They share an example of a successful trade and encourage viewers to study the strategy, backtest it, and apply it in live trading. The speaker also mentions exclusive content for course members and invites viewers to join for additional insights and live trading sessions.
Mindmap
Keywords
π‘Supply and Demand
π‘Liquidity
π‘Breaker Structure
π‘Gap in the Market
π‘Risk to Reward Ratio
π‘Stop Loss
π‘Swing High/Low
π‘Forex
π‘Mentorship
π‘Confluence
Highlights
The speaker shares a personal journey of financial success, going from $0 to over $500k in just 9 months.
Emphasizes the transformative power of the 'supply and demand trading' strategy.
Mentions the creation of a unique method within supply and demand trading that led to life-changing results.
Highlights the daily success of students applying the shared strategy.
Introduces the concept of supply and demand in trading, explaining it as sales and buys respectively.
Describes the significance of identifying strong supply or demand pushes as indicators of market liquidity.
Provides a visual demonstration of demand and supply zones on a Euro USD chart.
Explains the importance of gaps in the market and the principle that they must be filled.
Demonstrates how to identify and confirm gaps in the market with practical examples.
Stresses the inevitability of market gaps being filled, providing confidence in trading decisions.
Introduces the concept of 'breaker structures' as a key to understanding market direction.
Details how to identify and utilize higher highs and higher lows to anticipate market movement.
Discusses the significance of breaks in market structure as a signal for potential trend changes.
Teaches how to combine supply and demand zones, gaps, and breaker structures for effective trading.
Recommends using the 'Kill zones' indicator to determine optimal trading times.
Advises focusing on trades with a minimum risk-to-reward ratio of 1:3 for profitability.
Shares a personal trade example illustrating a 1:10 risk-to-reward outcome.
Encourages viewers to study the strategy, backtest it, and apply it live for success.
Invites interested individuals to join a course for further insights and live trading community access.
Transcripts
today I'm going to show you the exact
strategy that I used to go from $0 to
over 500k in just 9 months so if you've
been a part of my channel since the
beginning you see my life Chang
drastically I went from living with my
parents to moving into a $2 million
neighborhood traveling across the world
and driving Lamborghinis and the reason
why I was able to accomplish so much and
so little time is because of this
strategy called supply and demand
trading now there's a lot of people that
teach supply and demand but I came up
with my own method that changed my life
forever not only did it change my life
but I have students getting results
every single day I'm seeing students go
from nothing to getting funded to
getting payouts it's really amazing all
the lives that have been affected just
from me making this strategy and putting
in out to the world so by the end of
this video you'll know the exact same
strategy that I use so you can go use it
and potentially change your life let's
get into it before we get into this
video I got to let you guys know that
the Forex funer is back and better than
ever you can use match Trader C Trader
trade Locker whatever you prefer to use
they got it and yes they are servicing
the USA so I'll put the link down below
make sure you use the code offer 60 you
can get 60% off your challenge right now
so there's a lot of styles in the Forest
Community right now we got breakout
trading we got support and resistance
trading we got ICT trading there's
countless and countless of strategies
and I can tell you I've tried most of
them and even though you will win a
couple trades just longterm you're not
going to get the results you're look
looking for I've literally tooken
everyone's course everyone's mentorship
and until I made my own strategy nothing
was working I don't need you to take my
word for it just put this strategy to
use and I'm sure you'll see some results
supply and demand is the way that the
market moves I'm going to make this very
simple when you're looking for Supply
zones we're looking for sales when we're
looking for demand zones we're looking
for Buys so as soon as you hear Supply
it's just another word for SES soon as
you hear demand it's just another word
for buys no need to complicate it that's
all you need to know so when you see a
very strong Supply or demand push that
just means a whole bunch of liquidity
was just pumped into the market so we
know that the banks are trading at this
level so we definitely want to get in
that level when it comes back now let me
show you on the
[Music]
charts okay so we're just on a random
chart this is Euro USD and you can see
right here this is a perfect example of
a demand push price was going
sideways the banks entered they pumped
in a whole bunch of liquidity price shot
up like crazy right now it takes
billions of dollars to do this so when
we see that they entered right here we
know that when it comes back to this
Zone we want to be entering right here
as you can see price went up very simple
let's look at some Supply zones now
let's look at some Supply examples you
see this big candle right here I would
consider this a supply Zone we have one
red candle two candles I would consider
that a supply Zone same thing right here
I would consider this a demand Zone it
could be one count candle if it's very
large but we want it to be three candles
most of the time so let's find a good
example so look at this right here one
candle two candles three candles and
it's very large right so this is a
definitely a supply zone so we
definitely would want to take a trade
once it comes back up here to sell it
down now not all the time is it going to
just come here and then sell it down and
you could just enter a trade right it
could just shoot right up but that's why
we have other confluences that we'll get
into in a little bit but right now I'm
just going to show you what a supply
zone is so now that we know that the
banks and liquidity providers made the
market drop right here we will call this
a supply zone right so this is our
supply zone so we know that when we get
in this area price likes to drop even if
you drag this to the left you can see
right here price came in this area and
dropped so now we're building a story
right so let's look at some more
examples so right here is a very strong
demand push right all these candles
right here is a very strong demand push
even right here this one candle I would
consider a demand push is very large
right it took out multiple highs this is
a demand push banks are entering right
here banks are entering right here right
so then we have a demand zone right here
can say it's right here right price
pushed up came back down tapped this box
this demand zone is shot up same thing
with over here price pushed up came back
tapped his demand Zone shot up right so
now you can see when there's a supply
and demand Zone most of the time it'll
come back to that zone and shoot off
with momentum cuz this is where more
banks are entering all these Banks
entered right here but they left some
out so then when it comes back down all
the rest of the banks get in we push up
simple as that and you can see they're
everywhere right there's supply and
demand zones everywhere right Supply
Zone dropped aggressively showing us
momentum we know that the banks and
liquidity providers entered right here
right we get our box so Supply Zone drag
it across look it came back tapped that
zone dropped aggressively so we're
already adding to our story right you
want to build a story before you enter a
trade you want to know all the reasons
why you're entering a trade where
there's no doubt in your mind that
you're going to be right of course you
can do everything perfect and still lose
but the more confluences you have the
higher the percentage of you winning is
right so that's supply and demand right
very simple do not complicate it we see
a big push we know that there's
liquidity pumped in it's probably a
supply zone so the next thing we want to
move on to right is gaps in the market
when I found out about gaps in the
market it changed everything that I ever
thought I knew about Forex right gaps in
the market are so important so let's
erase all this and you can see right
here this is what you call a gap in the
market if you see this Wick right here
on this first candle this Wick the end
of it did not touch the third candle top
Wick right here right this Wick didn't
touch this Wick we're skipping the
middle candle this bottom Wick didn't
touch the top of this Wick right that is
a gap in the market it needs to touch
every time if it doesn't touch there's a
gap in the market and it must be filled
right I need you to listen to me 100% of
the time it will be filled we don't know
when it will be filled but it has to be
filled right it's just like the rules of
the market so let me show you what I
mean I mean you can see right here right
so when we think there's a gap all right
so if we put a line right here at the
bottom of this one and then we put
another line right here right this Gap
needs to be filled at some point in time
sometimes it'll do it instantly
sometimes it'll do it weeks from now but
it needs to be filled and we can use
that to our advantage you can see right
here right this Gap need to be filled it
came right to the line look how precise
that is came right to the line and then
we made our move to continue down so
these are very important need to learn
about the gaps in the market so let's go
look at some more gaps and I'm going to
show you that they always get filled no
matter what so you can be very confident
with these
so we have lots of gaps right here right
this is the candle that has the Gap
right so you can just look at it and say
oh I think there's a gap right on the
left and right side there's no Wicks
touching so then I'm going to say oh
let's verify this let's go to the first
candle before the candle that we think
has a gap and we're going to put a line
at the top of it right doesn't matter if
it's a wick or a candle body we just got
to go to the very top of it then we're
going to skip the candle that we think
has the gap which is this one go to the
third candle put it at the bottom of
that right
and now we see that there's a gap so
this needs to be filled so you can see
it come and gets filled now not all the
time is it just going to touch it and
continue your way but most of the time
it does but sometimes it'll just come
and fill it the point is we know that
this price needs to come here right so
once we start adding to our confluences
we're starting to build a better story
of why we should take it going up or
down right so that Gap was filled you
can see all these gaps get filled I'm
just going to Mark some out right Gap
right here skip the middle candle go to
the third one right it needs to be
filled it got filled every single Gap
there's a gap right here to right here
gets filled okay so now I'm going to
look to the left and just scroll to a
random spot and then we're going to pick
some random gaps and you're going to see
how they've been filled to start from
this day right here so you can see we
have a gap right here right so this
bottom Wick didn't touch the top of this
Wick right here so we have a gap so then
let's go scroll to the right see if it's
been filled okay it's been filled right
so now we know that price always has to
come fill these so now we got two two
things we have a supply and demand zones
and how to identify them now we know how
to find the gaps in the market and we
know that they need to be filled 100% so
let's look at some buy examples okay so
looking at this right here where do you
see the demand Gap in the market so what
does demand mean we're looking for buy
so that means we're looking for the
candles that are going up and that are
green right we're looking for demand
we're looking for a gap in a market so
if you said this you are correct if you
said this you are correct right these
are gaps in the market so let's get our
horizontal R to confirm it right so we
think this one has the Gap so we're
going to go to the candle before it put
it at the tip of it right and then on
the third one we put them at the bottom
of the tip so now we know that this
candle has a gap right these Wicks
aren't touching so this Gap needs to be
filled so let's scroll and see if it
gets filled and we can see it got filled
right here right so now let's move on to
the next thing so the third Confluence
that we need is we need to have a
breaker structure now breakup structures
are very very important to know what
direction the market wants to go in if
you don't have a breaker structure you
are trading blindly the breaker
structure is the confirmation that lets
us know hey we probably want to go in a
certain direction so let's locate some
breaker structures and talk about how
the market moves so the market moves in
higher highs and higher lows right so
higher high higher low higher high
higher low higher high higher low right
this high is higher than this high this
low is higher than this low so then this
is a higher high this is a higher low
this is a higher high because this high
is higher than this high this is a
higher low because this one is higher
than this one right very simple same
thing with the opposite direction lower
low lower high lower low lower high
right and it just keeps going now this
is a lower low because it's lower than
this low this is a lower high because
this is lower than this High very simple
so once we get these lower lows and
lower highs we know that the market
wants to continue its Trend down right
same thing what going up when we're
making higher highs and higher lows we
know that the trend wants to continue up
okay so I'm going to give you guys a
couple seconds to Mark out the higher
highs and higher lows in this situation
right so starting from here on where do
you see it give you a couple seconds
okay let's start from here we got a
higher high higher low higher high
higher low right so so it's very simple
once you know how the market moves we
can anticipate that price wants to go
higher once we hit this higher low once
price made this higher low we can
anticipate that price wants to go higher
so let's look at some more examples okay
so from here on we're going to be making
lower lows and lower highs so go ahead
and mark them up I'll give you a couple
seconds okay so we got a lower low lower
high lower low lower high lower low all
right so now we got lower lows and lower
high this is exactly what it looks like
so every time we get a lower low and
then a lower high we can anticipate that
price wants to go lower to make a new
lower low which it did right here price
came up make a lower high we can
anticipate it wants to go lower so now
we make a lower low so that's how the
market moves so now when it comes to
breaks of structure right a break of
structure is when price breaks out of
that Trend correct so if we have all
these lower lows and lower highs and
then price comes and makes a higher high
instead of a lower low now we have a
break of structure right so we've been
downtrending this whole time and when
price was supposed to make a lower high
to come make a lower low instead of
making a lower high it made a higher
high and then it made a higher low and
now price has changed right the trend
has changed so that's what breaker
structures are useful for so the way to
know if you have a true break of
structure is you're going to go to the
last lower high that was made right so
this was the last lower high that was
made before this lower low right so if
price comes and breaks this lower high I
I like to do it at the candle bodies
right so I'll put the line right on
these candle bodies right here cuz this
is the lower high so I to put the line
right there if price come breaks this
and closes above it we now have a higher
high and we just broke structure right
this is not supposed to happen unless
we're changing Trend so now we have a
breaker structure in the market this is
a great sign knowing that price wants to
shoot up and you can see it did we
started making higher highs higher lows
and we changed the whole Direction so
this is a break of Str structure we have
an example of a bearish breaker
structure right before it so let's go
over it so price was making higher highs
higher lows higher highs right and then
we get a break of structure right here
at the bottom of these bodies so since
this is the higher low before the last
higher high this would be our breaker
structure so we put the line the bottom
of the bodies right and if price comes
and closes below that we have a break of
structure which it did and what happened
right after that the trend changed went
from making higher highs and higher lows
to making lower lows lower highs right
so that is a breaker structure this is
very powerful stuff that I'm teaching
you right here so now that we went over
supply and demand zones we went over
gaps in the market we went over break of
structures now we need to put it all
together to form this amazing strategy
so now before we get into putting it all
together you need to have this indicator
that I'm using which is called kill
zones right these are this shaded area
right here here this lets us know when
we want to be looking for our setup so
all you got to do is go to indicators
type in Kill zones by Oscar vs I'll just
put another one on so you can see what
it look like so this is going to show
the different time frames for every
session right so we got Tokyo session we
got London session we got New York
session now I trade New York session it
just seems to be the best so I recommend
that you do too now if you can't make
New York session do London I would never
trade Tokyo but all you want to do to
make you look like mine is go to kill
zones go to the settings you want to
turn off every color that's not New York
session right we go to the inputs turn
all these off Tokyo session London
session turn off we only have New York
Hill zones and then you will get this so
we only want to take trades in this area
or an hour before nothing else so an
hour before New York session all the way
to like 9:00 Pacific time so now that we
have that we know when to look for our
trades okay so now I'm going to show you
guys how to put it all together so let's
get into it so first things first we
want to locate a supply or demand Zone
that we want to be looking for a trade
at so if you can see right here you have
a supply zone right here we have a
supply zone right here right so now we
got to ask oursel which one is breaking
structure so this one is not breaking
structure until this candle forms right
so then once this candle forms now we're
breaking structure so we say okay this
is the one we want to take cuz this is
the one that was breaking structure then
we ask ourselves was this a Supply push
yes it was we have two strong candles
showing momentum letting us know that
the banks and liquidity providers
entered right here so we have two things
checked off now we ask ourself was there
a Gap in the market on the Supply push
yes there was the bottom of this candle
is not touching the top of this candle
wick so then we will take our lines to
confirm it draw right there draw right
here it's a very small Gap right they
could be very small they're not always
going to be big and obvious you got to
really pay attention all right so now
that we that we have this Gap now we're
going to draw our supply Zone which we
want to take a trade from and the way
you do that is you take your rectangle
you're going to draw from the start of
the gap which is the first line that you
drew it's the start of the Gap and then
you're going to draw it to the swing
high or the swing low right in this case
it would be right here this is the swing
high so we draw a box up here and then
we drag it across now the swing high is
simple when you're going to draw your
box to the swing higher you're just
looking for the point where price came
down swung up and then dropped right so
price came down swung up this is the
highest point that it went to before it
dropped so it just looks like this swung
up dropped right so swung up dropped so
we put our box right there and the
reason why we put it at the swing highs
because if price comes and breaks that
then we don't want to be in that trade
no more because it's going the opposite
direction we're not breaking structure
so once we draw our box from the start
of the Gap to the swing High it'll be
right here so now when price comes and
Taps this like it did here this is where
we would want to enter
so now we have our box drawn up as soon
as price comes and taps our box like it
did here as soon as it Taps it we would
enter put our stops to the swing high
and then we'll go for a 1 and three
minimum so one and three is right here
ended up going for like a 1 four let's
say 13 you can see that TP was hit right
no draw down oops we had no draw down at
all as soon as it tapped it we dropped
we melted into our Direction and we hold
for 1 to three so that means we risked
1,000 to make $33,000 or $100 to make
$300 now this is the minimum right we
can always go for more you can see right
here when price came back up it didn't
even take us out why because we put our
stop loss to the swing high right so if
it breaks this we don't want to be in it
but this is going to keep us safe you
have to put it right there you can see
price didn't stop us out so we could
have held this all the way down for 1 to
10 bro 1 to 10 right here on this trade
this is just a random trade that I
pulled up a 1 to 10 so so that means if
you would have risked $1,000 you would
have made 10K in one day from one trade
and you would have to lose 10 times back
to back just to be at break even not
even to be in a loss just to be at break
even and this is how you become
successful when you have a highrisk
reward strategy so we don't take nothing
under a one and three so if we win a one
and three then we would have to lose
three trades back to back in order to be
at break even not even at lost and we
don't never lose three times back to
back so I want you guys to see how
powerful this strategy really is and
this is the reason why I went from being
broke to becoming a millionaire is
because I trade with high risk to reward
this is everything you need to change
your life now of course there's a couple
things that I'm leaving out that would
increase your win rate dramatically and
would help you get to your destination
fast and help you win more trades but
that stuff is for my course members and
if I was to put it in this video my
students would literally track me down
so I suggest if you're really going to
take this serious I suggest you join my
course get the missing pieces to the
puzzle we also have a live trading
Discord in there where you can see the
strategy be put to use every single
morning but I don't want you to go watch
another person's video this is all you
need right here study this video over
and over back test Trade It live and
you'll see the results all I ask is for
you to hit me up when you get your first
payout and let me know it worked for you
I'll see you guys next time peace
Browse More Related Video
Master Supply & Demand Trading (ULTIMATE In-Depth Guide)
Master Liquidity Concepts (Mechanical Strategy)
BEST US30 STRATEGY IN 2024
HOW TO DRAW PERFECT DEMAND AND SUPPLY ZONES(SUPPORT AND RESISTANCE) IN THE FOREX MARKET
The Only Day Trading Strategy You'll Ever Need (Beginner to Pro)
This Supply & Demand Strategy Will Make You 10X Better As A Beginner
5.0 / 5 (0 votes)