Algebra 5.1 (Version A) - Exponential Growth
Summary
TLDRIn this educational video, Aiden Gonzalez explores the exponential growth of diseases, using COVID-19 as a case study. He explains how the virus spread rapidly due to its ability to infect multiple people, leading to a significant increase in cases over a short period. The video delves into the mathematics of exponential growth, illustrating the concept with a simple multiplication model and real-world data. It also discusses the importance of public health measures like 'flattening the curve' to reduce infection rates and prevent healthcare systems from being overwhelmed. The video concludes with a discussion on the impact of various government mandates on infection rates and their potential to save lives, encouraging viewers to consider the trade-offs of different public health strategies.
Takeaways
- ๐ The video script is an educational piece discussing exponential growth in the context of disease spread, specifically COVID-19.
- ๐ The script uses a simple mathematical model to illustrate how diseases can spread exponentially, doubling the number of cases with each passing day.
- ๐ It outlines the early timeline of COVID-19 in the United States, highlighting key dates and milestones in the pandemic's escalation.
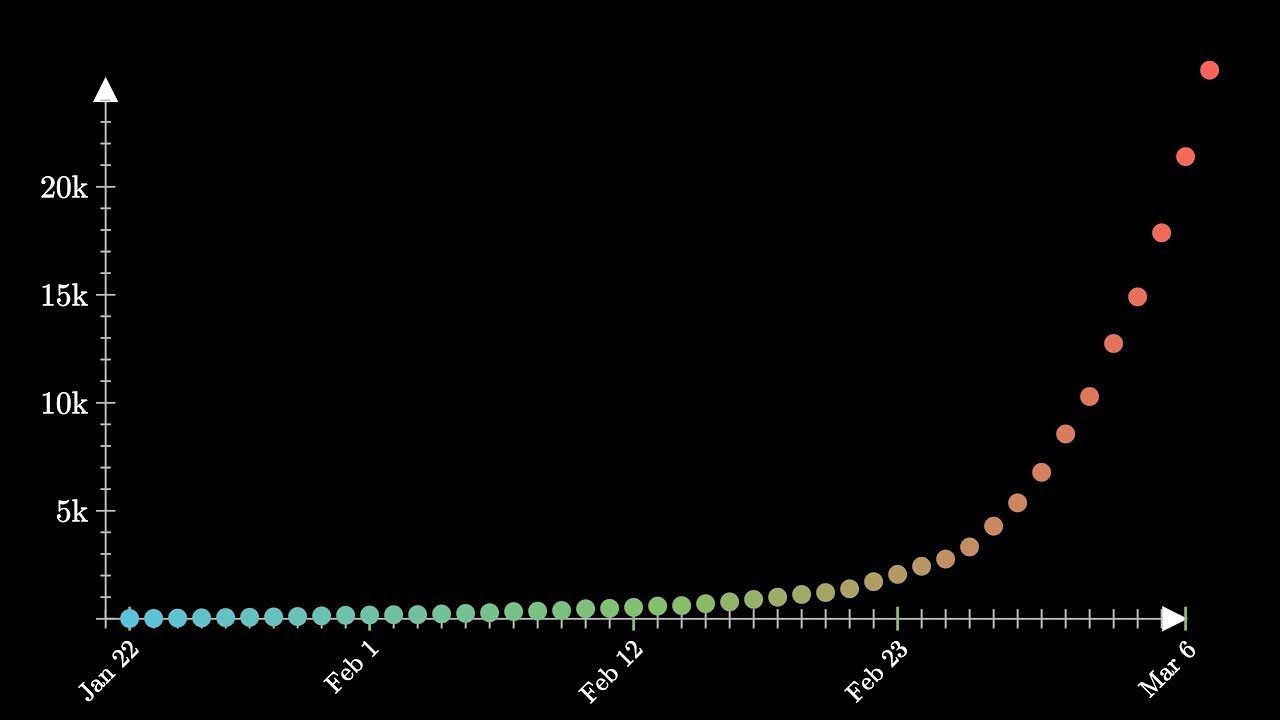
- ๐ The script includes a graph to visually represent the exponential growth of COVID-19 cases over time, showing an initial slow growth that accelerates.
- ๐งฎ Mathematical modeling is used to predict the spread of the virus, with the formula y = a * b^x where x is the number of days, and b is the growth rate.
- ๐ The script references real-world data from 'Our World in Data' to demonstrate the exponential growth pattern observed in the early stages of the pandemic.
- ๐ข The concept of 'flattening the curve' is introduced as a public health strategy to slow the spread of the virus and prevent healthcare systems from becoming overwhelmed.
- ๐ฅ The script discusses the impact of public health measures such as mask mandates and social distancing on reducing the infection rate and saving lives.
- ๐ค It poses thought-provoking questions about the trade-offs between public health measures and their economic and social implications, encouraging critical thinking about policy decisions.
- ๐ The script concludes by emphasizing the importance of mathematical models in predicting and managing the spread of diseases like COVID-19.
Q & A
What is the main topic discussed in Aiden Gonzalez's video?
-The main topic discussed is the spread of disease, specifically COVID-19, and how exponential growth models can be used to understand and predict the spread.
What is the significance of the timeline of COVID-19 in the United States presented in the video?
-The timeline is significant as it shows the rapid escalation of cases from the first reported case to widespread infection, illustrating the concept of exponential growth.
How does the video explain the concept of exponential growth in relation to virus spread?
-The video explains exponential growth by demonstrating how an infected individual can spread the virus to two new people, who then each spread it to two more, and so on, doubling the number of new infections each day.
What is the mathematical representation of exponential growth used in the video?
-The mathematical representation used is y = a * b^x, where 'x' represents days, 'y' represents the number of new infections, 'a' is the starting value (y-intercept), and 'b' is the growth rate multiplier.
What was the first case of COVID-19 in the United States according to the video?
-The first case of COVID-19 in the United States was reported in Washington state on January 21st.
How does the video demonstrate the rate of change in the number of new infections over time?
-The video shows that initially, the rate of change is slow, but as time progresses, the rate of new infections accelerates, highlighting the exponential nature of the spread.
What role do public health measures play in the video's discussion on disease spread?
-Public health measures are discussed as a way to 'flatten the curve' by reducing the infection rate, thereby slowing the spread of the disease and preventing healthcare systems from becoming overwhelmed.
How does the video use the concept of 'flattening the curve' in relation to COVID-19?
-The video uses 'flattening the curve' to illustrate the importance of reducing the rate of infection to keep the number of cases below hospital capacity, thus saving lives and reducing the strain on healthcare systems.
What is the significance of the death rate in the context of the video's discussion on COVID-19?
-The death rate is significant as it helps to estimate the potential loss of life from the disease. The video uses this rate to predict the number of deaths based on the number of new infections.
How does the video address the balance between public health measures and economic impact?
-The video addresses this balance by presenting hypothetical scenarios where stricter measures like outdoor dining bans could further reduce infection rates but also have significant economic consequences, prompting viewers to consider the trade-offs.
Outlines
๐ Introduction to Exponential Growth and COVID-19
In the first paragraph, Aiden Gonzalez introduces himself as a recent high school math graduate working on the algebra curriculum for Skew the Script. The focus is on exponential growth and its application to modeling the spread of diseases, specifically COVID-19. Aiden discusses the alarming rise in COVID-19 cases in the United States, starting from the first reported case on January 21st and the subsequent rapid increase, leading to the pandemic being declared by the WHO. The paragraph emphasizes the importance of understanding exponential growth in the context of disease spread, using a simple multiplication model to illustrate how quickly infections can increase over time.
๐ข Modeling Exponential Growth with COVID-19 Data
The second paragraph delves into the mathematical modeling of exponential growth using the example of COVID-19. Aiden explains the concept of repeated multiplication leading to exponential growth, using a table to show how the number of new infections doubles each day. The paragraph introduces the exponential growth model formula "y = a ร b^x", where 'a' is the starting value, 'b' is the growth rate, and 'x' represents the days. Aiden demonstrates how this model can be used to predict the number of new infections and the corresponding death toll, highlighting the utility of such models in resource distribution and decision-making during the pandemic.
๐ก The Impact of Public Health Measures on Disease Spread
In the final paragraph, Aiden discusses the effect of public health measures on the spread of COVID-19. He contrasts the scenario with and without such measures, showing how interventions like mask mandates and travel restrictions can significantly reduce the infection rate. The paragraph also touches on the concept of 'flattening the curve,' which aims to keep the number of cases below hospital capacities. Aiden presents a hypothetical scenario where further restrictions could lead to an even lower infection rate, prompting a discussion on the trade-offs between public health measures and their economic and social impacts. The paragraph concludes with a call to action for viewers to consider the implications of different public health policies on disease spread and mortality.
Mindmap
Keywords
๐กExponential Growth
๐กCOVID-19
๐กPandemic
๐กStay-at-Home Order
๐กFlatten the Curve
๐กEpidemiology
๐กInfection Rate
๐กDeath Rate
๐กPublic Health Measures
๐กModeling
๐กResource Distribution
Highlights
Introduction to exponential growth and its relation to disease spread, specifically COVID-19.
Timeline of early COVID-19 cases in the United States, illustrating rapid escalation.
Explanation of how viruses spread through exponential growth, doubling the number of cases each day.
Graphical representation of exponential growth over time, showing an increasing rate of new infections.
Real data comparison with the exponential growth model, highlighting the early slow growth and subsequent acceleration.
The importance of modeling in predicting disease spread and its utility in resource distribution and decision-making.
Definition and application of the exponential growth model formula \( y = ab^x \) to predict new infections.
Calculation showing the number of new infections and corresponding death toll predictions using the model.
Discussion on how public health measures like 'flatten the curve' campaigns can reduce infection rates.
Impact of reduced infection rates on the number of lives saved, using hypothetical infection rate changes.
Comparison of disease spread with and without public health measures, demonstrating the effectiveness of interventions.
Theoretical discussion on the potential impact of more restrictive measures, such as outdoor dining bans, on infection rates.
Calculation of lives saved by hypothetically reducing the infection rate to 0.1499 with an outdoor dining ban.
Reflection on the balance between public health measures and their economic and social impacts.
Conclusion of the discussion on exponential growth modeling and its application to pandemic response strategies.
Transcripts
hello mathematicians i'm aiden gonzalez
and i'm a recently graduated high school
math student
working with skew the script on a few of
the algebra curriculum lessons
today we're going to be talking about
the spread of disease specifically copin
19
and exponential growth let's skew it
[Music]
today we're going to be talking about
exponential growth and modeling disease
this is lesson 5.1 in our algebra course
sequence
specifically we're going to be talking
about cove 19 or the coronavirus
uh the chronovirus pandemic was one of
the deadliest pandemics the world has
ever seen
and here's a video that shows the early
timeline of covid19 in the united states
the coronavirus has changed life as we
know it across america
but how did we go from zero cases to
having more than any other country
the timeline starts on january 21st when
washington state reports the first
coronavirus case in the united states
this is certainly not a moment for panic
or high anxiety it is a moment for
vigilance
within a week the cdc confirms illinois
california and arizona also have cases
and on january 30th chicago witnesses
the first person-to-person transmission
in the country
february 17th confirmed coronavirus
cases in the u.s
increased to 15. and by march 8
confirmed u.s coronavirus cases
reached the 500 mark the world health
organization
then declares this three days later
kovid 19
can be characterized as a pandemic
and the next day california issues a
statewide stay at home order
we are confident that the people of the
state of california
will abide by it several states soon
follow suit
stay at home stay home stay safe and
quite simply
stay at home by march 23rd new york has
emerged as the epicenter of the outbreak
with over 20 000 cases
non-stop literally a lot of people come
they not really survive they expire
so here's a timeline of a few key events
in the early covet 19 pandemic
on january 21st we have our first case
in the united states
a little less than a month after that we
have 15 cases in the united states
a few weeks after that 500 cases and
then two weeks after that
20 000 cases in new york alone
so far more than 600 000 americans have
died from covet 19.
how did the covenant pandemic escalate
so quickly that's what we'll be
exploring today
in today's key analysis as always you
can follow along using the guided nodes
at the url below
let's talk about multiplication and
exponential growth
here's how viruses spread we have an
infected individual
and they spread it to two new people on
day one we have two new infections
those two people each spread it to two
new people
so on day two we have four new
infections those four people
spread into two new people each we have
eight new infections on day three
on day four we have 16 new infections
and on day five
we have 32 new infections there's a
pattern here in the number of new
infections
we multiply by two today's in new
infections
are yesterday's number multiplied by two
we can graph this exponential growth
with our x being our days
and our y being our number of new
infections here's our axes with
our x being our days and our y being our
number of new infections
here are our points from our table
and we can see this is the exponential
growth what happens to the number of new
infections over time
we can see that as time goes on the
number of new infections
goes up the number of infections
increases
what happens to the rate of change in
the number of new infections over time
we can see that at first the growth is
slow
the rate of change is small as time goes
on
the growth accelerates let's turn to
real data
here's the cobia 19 global case counts
uh in the first few weeks
of the pandemic from our world and data
we can see this the exponential growth
model is similar to our simple
times two model at first the growth is
slow
and slowly growth accelerates over time
and this is how the kova 19 pandemic
escalated so quickly
the statistician george e p fox famously
said
all models are wrong but some are useful
although this model doesn't exactly fit
every data value
explain why it may still be useful and
as a hint
think about making predictions now we're
going to talk about modeling exponential
growth
remember how viruses spread the number
of new infections
is yesterday's new infections multiplied
by two
this repeated multiplication is
exponents repeated multiplication by a
number that's greater than one
leads to exponential growth here we have
our table
our day one we have two new infections
we multiply that by two
to get four new infections on day two
multiply that by
two to get eight and again by two to get
sixteen and again
by two to get thirty two on day one we
have two ones
on day two we have two multiplied by
itself twice
on day three we have two multiplied by
itself three times
on day four and five we have two
multiplied by itself four and five times
that's our exponent on day one we have
two to the first power which is two
on day two we have two to the second
power which just means two
times two which is four and then on day
three
we have two to the third power which
indicates two times itself three times
which is eight
and again for four and five so now we're
going to take our data from our table
and fit it to this exponential growth
model of y equals
a times b to the x our x is equal to our
days and our y
is equal to the number of new infections
our a
is our starting value our y-intercept
and our b is our growth rate our
multiplier
starting with our growth weight growth
rate um we
remember that the pattern is we multiply
by two so two is our multiplier
our starting value our y intercept is
the y value
when x is equal to zero in our table
when days are equal to zero our x is
equal to zero the number of new
infections is one
so our starting value is one
to see if this matches up uh to see if
our model matches up with our table
let's plug in days for zero for x
so we have y is equal to one times two
to the zero power
we do exponents first thanks to pemdas
two to the zero power is one one times
one
is equal to one that matches up with our
table let's do
for day three plug in three for x so we
have y is equal to one times two to the
third power
again doing exponents first we have two
times two times two
which is eight one times eight is equal
to eight
and eight is the number of new
infections that we have in our table for
day three so that lines up perfectly
let's move on to making predictions
scientists used exponential models to
forecast the spread of coven 19
which helped governments distribute
resources and make decisions
here we can see the cdc using different
exponential models to predict
um to predict the spread of coven
so how many new infections will there be
on day 10
using our model y is equal to 1 times 2
to the x we can plug in
10 for x to find out y the number of new
infections
y is equal to 1 times 2 to the 10th
power using our calculator we can see
that
2 to the 10th power is 1024
y is equal to 1024 on day 10.
10 days into the pandemic there are 1024
new infections per day
optimistic estimates for the coba 19
death rate at 1.5 percent
with variation based on based on health
and age etc
what's the expected death toll from the
day 10 infections
so on day 10 we had 1024 new infections
we can multiply this for our death rate
as a decimal of
0.015 to get 15 new deaths
predict the number of new infections on
day 30 one month
uh into the pandemic and the
corresponding death toll
so using our equation y is equal to 1
times 2 to the x
we're going to plug in 30 for x 30 days
so y is equal to 1 times 2 to the 30th
power
2 to the 30th power is this huge number
1 billion
three million seven hundred forty one
thousand eight hundred twenty four
so we have thirty days into the pandemic
a little more more than one billion new
infections
per day with these a little more than 1
billion new infections
using our death toll of 0.015
we have about 15 million 15 million
deaths
the kova 19 pandemic was devastating
with more than 4
million deaths worldwide and 600 000 in
the united states
thankfully though the death count never
got as high as 15 million in a single
day
the 15 million that we just predicted
what slowed down the virus
this leads us to our discussion its
growth rate wasn't as high as the two
times uh that we we predicted in our
model
resistance spreads as people get sick
and recover but there's another
important reason
and that's the flat in the curve flatten
the curve was
all over news headlines um and this was
just a public health campaign to keep
infections below hospital capacities we
were all encouraged to wear masks
to avoid travel to avoid events to wash
our hands regularly
so we could stop the spread and keep the
number of cases
below hospital capacities
let's turn to the spread of coping or
the spread of disease in general
this is what happens we have no public
health measures
we each spread it to two new people so
on day four we have 16 cases
those 16 people spread it to two new
people each we have 32 new cases on day
five
let's say though after two days of
spread mandate uh there's a mandate
saying that we all have to wear masks
can't everyone cancel your travel other
similar things so on day
two um public health measures
are imposed this reduces the infection
rate
to 1.5 from two times to times 1.5
so on day four there are nine new
infections
and on day five there are 13 new
infections
here's what it looks like with no public
health measures and here's what it looks
like
with public health measures being
imposed um a few days in
so flattening the curve enforcing this
mass mandate
would reduce the rate of spread from two
times to 1.5 times
given a death rate of 1.5 percent how
many lives would this save
daily a month or 30 days into the
pandemic
and note only consider deaths from new
infections on
day 30. once you finish those
calculations let's turn to a different
example
in addition to masks there were also
some more controversial and restrictive
government mandates during the pandemic
here's a picture of restaurant workers
in long beach
protesting job losses from dining
restrictions some people due to these
dining restri
restrictions lost their businesses and
or their livelihoods
a second discussion question is mask
wearing an indoor dining ban
and other measures reduce the infection
rate to 1.5
the government is also considering an
outdoor dining ban
which would reduce the rate of infection
to 0.1.4999
note that these are completely
hypothetical numbers just for a thought
experiment
it's almost impossible to measure the
true infection rates so these rates are
just to get you thinking about public
health trade-offs
should the government also enforce an
outdoor dining ban support your answer
by calculating the lives saved by the
outdoor band
on day 30. that's it for today
and we'll see you next time on skew the
script
[Music]
Browse More Related Video
CARA PENULARAN DAN PENCEGAHAN PANDEMI COVID 19 DALAM MATEMATIKA
Fungsi Eksponen Matematika Peminatan Kelas X - Apersepsi Masalah COVID-19
REPRESENTING REAL-LIFE SITUATIONS USING EXPONENTIAL FUNCTIONS || GRADE 11 GENERAL MATHEMATICS Q1
COVID-19: Statistics trigger policy decisions | COVID-19 Special
10. Diseases and Immunity (Cambridge IGCSE Biology 0610 for exams in 2023, 2024 and 2025)
Exponential Growth
5.0 / 5 (0 votes)