Fungsi Eksponen Matematika Peminatan Kelas X - Apersepsi Masalah COVID-19
Summary
TLDRIn this educational video, Deni from Metland channel explores the concept of exponential functions, their applications in real-life scenarios such as compound interest and bacterial growth, and their relevance to understanding exponential growth, exemplified by the spread of COVID-19. The video delves into the general form of exponential functions, the impact of the base value on the graph's behavior, and the function's relationship with its asymptotes. It also covers how to graph exponential functions using GeoGebra, discusses the influence of the constant 'k' on the function's position relative to the x-axis, and provides problem-solving examples to solidify understanding.
Takeaways
- 📚 The video is an educational tutorial about exponential functions, their applications, and their graphs.
- 🌐 Exponential functions are widely applied in real-life scenarios, such as compound interest and the growth of bacteria and viruses, including COVID-19.
- 📈 The general form of an exponential function is f(x) = a * b^x, where a is the constant and b is the base, which must be positive and not equal to one.
- 🚫 The base of the exponential function cannot be negative or equal to one, as this would result in a non-exponential graph, such as a straight line.
- 📉 The graph of an exponential function is affected by the value of the base: if the base is greater than one, the graph is monotonically increasing; if the base is between zero and one, the graph is monotonically decreasing.
- 🔄 The graph of an exponential function can be transformed vertically by adding or subtracting a constant, which changes the asymptote of the function.
- 📊 The video uses GeoGebra, a mathematical software, to demonstrate how changes in the base and constant affect the graph of exponential functions.
- 🔢 The tutorial includes solving problems related to exponential functions, such as finding the coordinates of points on the graph and determining the behavior of the function based on its properties.
- 📉 The video explains the concept of asymptotes in exponential functions, which are lines that the graph approaches but never intersects.
- 🎯 The tutorial concludes with practice problems to reinforce understanding, including determining the correct answers from multiple-choice questions related to the properties and graphs of exponential functions.
Q & A
What is the general form of an exponential function?
-The general form of an exponential function is f(x) = a^x, where 'a' is the base and 'x' is the exponent or the independent variable.
What are the conditions for the base 'a' in an exponential function?
-The base 'a' in an exponential function must be greater than zero and not equal to one.
How does the value of the base 'a' affect the graph of the exponential function?
-If the base 'a' is greater than one, the graph of the exponential function is monotonically increasing. If 'a' is between zero and one, the graph is monotonically decreasing.
What is the horizontal asymptote for the standard exponential function y = a^x?
-The horizontal asymptote for the standard exponential function y = a^x is the x-axis (y = 0), as the function never intersects this line.
How does adding a constant to the exponential function affect its graph?
-Adding a constant to the exponential function shifts the graph vertically. If the constant is positive, the graph shifts upwards, and if it's negative, it shifts downwards.
What is the relationship between the base 'a' being positive or negative and the position of the graph of the exponential function?
-If the base 'a' is positive, the graph of the exponential function lies above the x-axis. If 'a' is negative, the graph is reflected below the x-axis.
How does the value of the exponent 'x' affect the graph of the exponential function?
-As the exponent 'x' increases, the value of the function also increases, causing the graph to rise. Conversely, as 'x' decreases, the value of the function decreases, causing the graph to fall.
What is the significance of the exponential function in real-life applications?
-Exponential functions are significant in real-life applications such as modeling compound interest, population growth, and the spread of diseases like COVID-19.
What is the term used for the line that a graph approaches but never touches in an exponential function?
-The term used for the line that a graph approaches but never touches in an exponential function is 'asymptote'.
How can you determine if an exponential function is monotonically increasing or decreasing?
-An exponential function is monotonically increasing if the base 'a' is greater than one and monotonically decreasing if 'a' is between zero and one.
Outlines

This section is available to paid users only. Please upgrade to access this part.
Upgrade NowMindmap

This section is available to paid users only. Please upgrade to access this part.
Upgrade NowKeywords

This section is available to paid users only. Please upgrade to access this part.
Upgrade NowHighlights

This section is available to paid users only. Please upgrade to access this part.
Upgrade NowTranscripts

This section is available to paid users only. Please upgrade to access this part.
Upgrade NowBrowse More Related Video

REPRESENTING REAL-LIFE SITUATIONS USING EXPONENTIAL FUNCTIONS || GRADE 11 GENERAL MATHEMATICS Q1

Fungsi Eksponensial Matematika Lanjut Kelas XI
Representing Real Life Situations Using Exponential Functions (General Mathematics)

Fungsi Eksponen Pertumbuhan dan Peluruhan
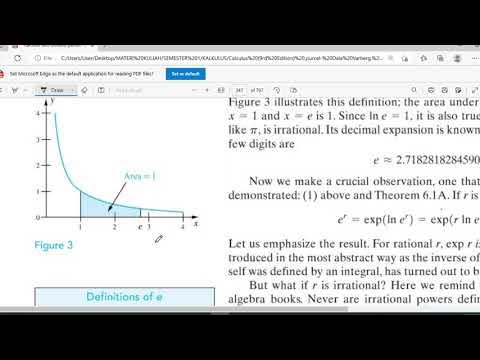
Fungsi Transenden 3 (Fungsi Eksponensial Natural)
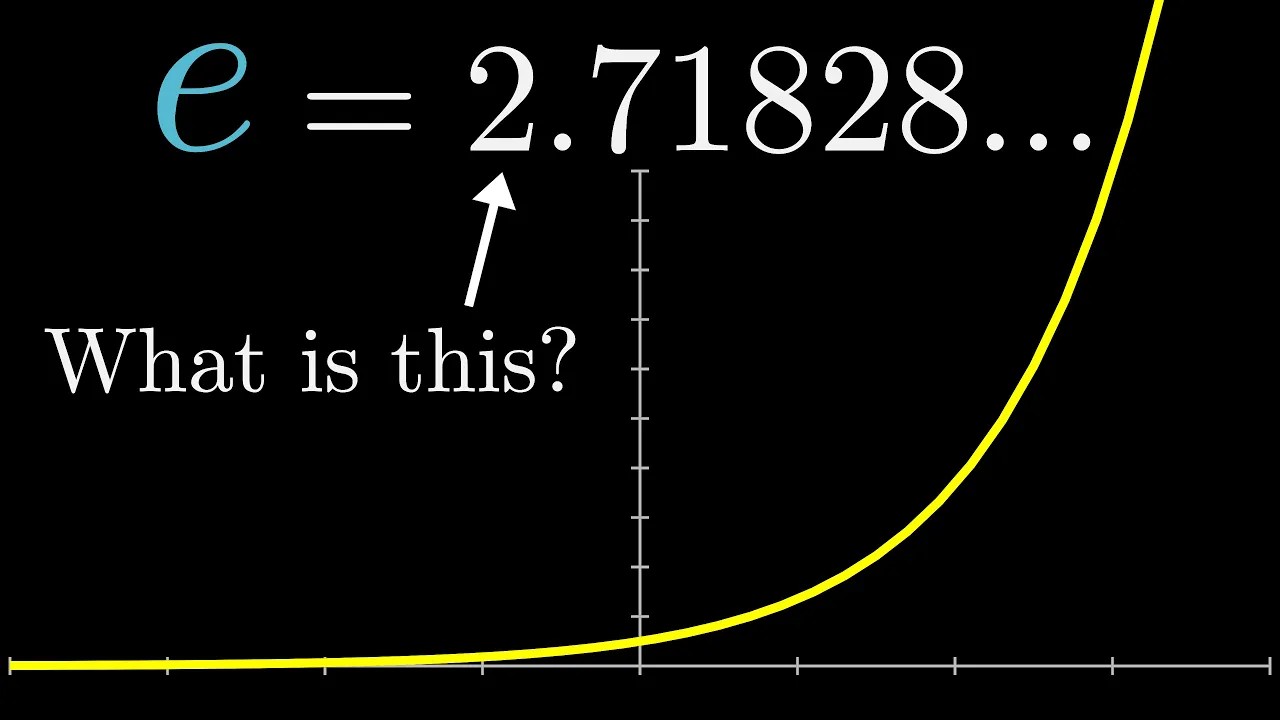
What's so special about Euler's number e? | Chapter 5, Essence of calculus
5.0 / 5 (0 votes)