How to interpret an ECG systematically | EXPLAINED CLEARLY!
Summary
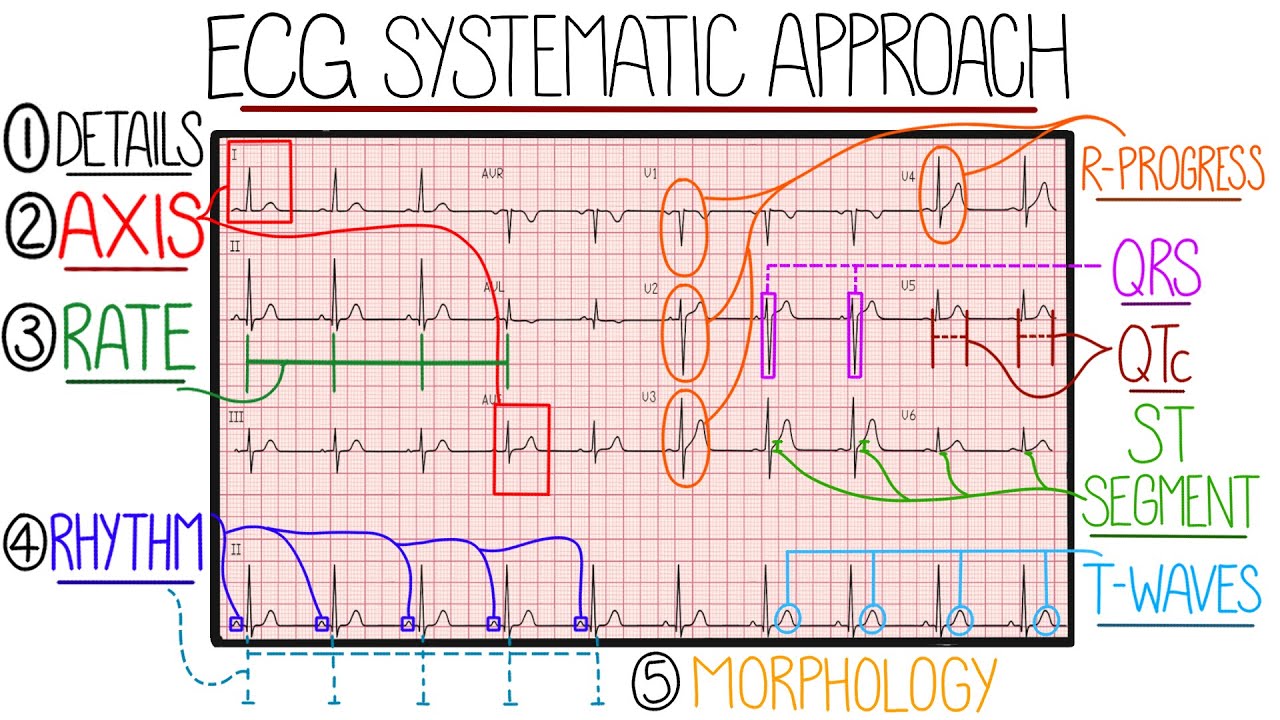
TLDRThis video tutorial offers a structured approach to interpreting ECGs, essential for medical students and junior doctors. It covers patient details, calibration checks, and a systematic method starting with rate, rhythm, and axis, followed by in-depth analysis of each ECG component. The guide also discusses common abnormalities, such as different types of heart blocks and myocardial infarction, providing a foundation for diagnosing cardiac conditions.
Takeaways
- π Always verify patient details and ECG calibration before interpretation to avoid errors and ensure accuracy.
- π Calculate the heart rate using either the number of large squares in the RR interval or by counting QRS complexes over a 10-second rhythm strip.
- π Understand the difference between regular and irregular rhythms, and identify specific conditions like second-degree AV block type 1 (Wenckebach phenomenon) and atrial fibrillation.
- π Assess the cardiac axis using leads I, II, and III to determine if there's any left or right axis deviation, which can indicate certain cardiac conditions.
- π Check the presence and appearance of P waves in all 12 leads to identify atrial activity and conditions like atrial fibrillation or atrial enlargement.
- β±οΈ Evaluate the PR interval to determine if there's first-degree heart block or other conduction delays.
- π Examine the QRS complex for width, height, and morphology to detect abnormalities like bundle branch blocks or myocardial infarctions.
- π Look for ST segment deviations that could signify myocardial ischemia or infarction, distinguishing between STEMI and NSTEMI.
- π Assess T wave appearance to identify conditions like hyperkalemia, ischemia, or pulmonary embolism.
- β²οΈ Measure the QT interval and consider factors like heart rate and medication effects to identify potential risks for arrhythmias like Torsades de Pointes.
Q & A
What is the first step in interpreting an ECG according to the video?
-The first step is checking patient details using three pieces of identification, which is crucial as missing this step in exams could result in zero marks.
What should be the paper speed and amplitude calibration for a standard ECG?
-The paper speed should be 25 millimeters per second, with one small square equivalent to 0.04 seconds and one large square to 0.2 seconds. The amplitude calibration should be 10 millimeters per millivolt.
How can one calculate the heart rate on an ECG with a regular rhythm?
-For a regular rhythm, you can use the equation 300 divided by the number of large squares in the RR interval to calculate the heart rate.
What is the alternative method to calculate the heart rate if the rhythm is irregular?
-If the rhythm is irregular, you count the number of QRS complexes along the rhythm strip and multiply it by six, as the total length of the rhythm strip is 10 seconds.
What does a normal adult heart rate range from?
-A normal adult heart rate ranges from 60 to 100 beats per minute, with bradycardia being slower than this and tachycardia being faster.
How can you determine if the ECG rhythm is regular or irregular?
-You can determine the rhythm by placing a piece of paper above the start of the rhythm strip and marking three or four R waves, then moving the paper along the strip to see if the lines match up with subsequent R waves.
What does the term 'Wenckebach phenomenon' refer to in the context of ECG interpretation?
-The term 'Wenckebach phenomenon' refers to second-degree AV block type 1, where there is a predictable pattern of QRS complexes followed by a pause, often seen as two QRS complexes followed by a pause and then the same again repeated.
What does the cardiac axis represent and what is the normal range for it?
-The cardiac axis represents the average direction of electrical depolarization through the ventricles. In healthy individuals, this average direction is between -30 and positive 90 degrees in the coronal plane.
How can you identify if there's left axis deviation or right axis deviation on an ECG?
-You can identify axis deviation by comparing the QRS complexes in leads 1, 2, and 3. For a normal axis, lead 2 should be more positive than at least one of the other leads. In right axis deviation, lead 3 is more positive than lead 2 and 1, and in left axis deviation, lead 1 is more positive than lead 3 and 2.
What does the absence of P waves with an irregularly irregular rhythm indicate on an ECG?
-The absence of P waves with an irregularly irregular rhythm indicates atrial fibrillation, which is a common finding in medical school exams and clinical practice.
What is the normal duration of the PR interval and what does a prolonged PR interval indicate?
-A normal PR interval is 0.12 to 0.20 seconds or 3 to 5 small squares. A prolonged PR interval indicates first-degree heart block, which is caused by the AV node conducting electricity slower than normal.
What does a Delta wave in the QRS complex signify?
-A Delta wave in the QRS complex signifies an abnormality and can be seen in conditions such as Wolf Parkinson White syndrome.
What is the significance of a pathological Q wave on an ECG?
-A pathological Q wave, which is longer and taller than normal, often represents an old myocardial infarction.
What does ST segment elevation or depression on an ECG indicate?
-ST segment elevation or depression can indicate myocardial ischemia. If present in two or more contiguous leads, it suggests ischemia is likely present. ST elevation specifically can indicate a STEMI (ST elevation myocardial infarction).
What does the assessment of T waves on an ECG represent?
-The assessment of T waves on an ECG represents ventricular repolarization. Abnormal T waves, such as being tall, normal, or inverted, can indicate conditions like hyperkalemia, myocardial infarction, or pulmonary embolus.
What is the normal QT interval and why is it important to calculate the corrected QT interval?
-A normal QT interval is less than 440 milliseconds in men or less than 460 milliseconds in women. The corrected QT interval is calculated to standardize the QT interval to 60 beats per minute, accounting for variations due to heart rate.
Why is it important to assess the ECG components in all 12 leads?
-Assessing the ECG components in all 12 leads is important to avoid missing any abnormalities, as different leads provide different views of the heart's electrical activity.
Outlines
π ECG Interpretation Basics
This paragraph introduces the video's focus on a structured approach to ECG interpretation, essential for medical exams and clinical practice. It emphasizes the importance of checking patient details and calibration before diving into the ECG's interpretation. The video script outlines a systematic method to analyze an ECG, starting with rate, rhythm, and axis, followed by a step-by-step examination of the ECG's components. The paragraph also explains how to calculate heart rates in both regular and irregular rhythms, using the RR interval and QRS complexes.
π Assessing Rhythm and Cardiac Axis
The second paragraph delves into the assessment of cardiac rhythm and axis. It explains how to determine if a rhythm is regular or irregular using the Rhythm strip and a paper method for visual alignment. The paragraph introduces the concept of second-degree AV block type 1, also known as the Wenckebach phenomenon, and contrasts it with atrial fibrillation, an example of an irregularly irregular rhythm. The discussion then shifts to the cardiac axis, detailing how to identify left and right axis deviations by examining the QRS complexes in leads 1, 2, and 3.
π‘οΈ ECG Component Analysis
This paragraph provides a comprehensive guide to analyzing individual ECG components, including the P wave, PR interval, QRS complex, ST segment, T waves, and QT interval. It discusses the significance of each component's presence, appearance, and measurements, such as the width and height of the QRS complex and the shape of the P wave. The paragraph also covers abnormalities like bundle branch blocks, Delta waves, pathological Q waves, and conditions that affect the ST segment, such as ischemia and myocardial infarction.
π Conclusion and Further Learning
The final paragraph wraps up the ECG interpretation process by summarizing the steps taken in the video and encouraging viewers to continue their learning with the third and final video in the series. It reiterates the importance of checking patient details and ECG calibration, followed by a systematic analysis of the ECG's rate, rhythm, axis, and individual components. The paragraph also highlights the need to assess each component in all 12 leads to avoid missing any abnormalities.
Mindmap
Keywords
π‘ECG (Electrocardiogram)
π‘Calibration
π‘Heart Rate
π‘Rhythm
π‘Cardiac Axis
π‘P Wave
π‘PR Interval
π‘QRS Complex
π‘ST Segment
π‘T Wave
π‘QT Interval
Highlights
A structured approach to interpreting ECGs for medical exams and practice.
Importance of checking patient details and ECG calibration before interpretation.
Explanation of how to calculate heart rate using RR intervals and QRS complexes.
Distinguishing between regular and irregular heart rhythms using the Rhythm strip.
Identification of second-degree AV block type 1, also known as Wenckebach phenomenon.
Assessment of cardiac axis and its deviation from normal values.
Use of leads 1, 2, and 3 to determine cardiac axis deviation.
Analysis of P waves for atrial depolarization and detection of atrial fibrillation.
Assessment of PR interval for atrial-ventricular node conduction.
Identification of first-degree heart block and second-degree heart block Mobitz type 1.
Evaluation of QRS complex width, height, and morphology for abnormalities.
Explanation of bundle branch blocks and their impact on QRS complex shape.
Assessment of ST segment for signs of myocardial infarction or ischemia.
Differentiation between STEMI and NSTEMI based on ST segment elevation.
Analysis of T waves for signs of hyperkalemia, ischemia, or infarction.
Evaluation of QT interval and its significance in detecting conditions like long QT syndrome.
Introduction to QT correction formulas like Bazett's for standardized assessment.
Summary of the ECG interpretation process from patient details to individual ECG components.
Transcripts
in this video we're going to cover how
to interpret an ECG from start to finish
using a structured and easy to follow
approach that will get you through
Medical School exams and is one that I
still use today as a junior doctor
if you want to learn about the basics of
what ECG components mean then check out
my previous video called ECG basics
the first step to interpreting any ECG
is checking patient details using three
pieces of identification
missing this step in exams could result
in you getting zero marks
step two is checking calibration
this means checking the paper speed
which should be 25 millimeters per
second
this speed will mean that one small
square is equivalent to 0.04 seconds and
one large square is 0.2 seconds
also check the calibration of amplitude
which should be 10 millimeters per
millivolt
now we can move on to our interpretation
to avoid missing any steps it's useful
to follow a structure when interpreting
the ECG
the easiest structure I think to
remember is rate Rhythm and axis
followed by each component of the ECG
complex in the order that it arises
so let's go through each of these steps
in order
first is calculating the heart rate
a normal adult heartbeats at 60 to 100
beats per minute
with bradycardia meaning slower than
this and tachycardia being faster
there are two methods to calculating the
rates
the first way is to use the equation 300
divided by the number of large squares
in the RR interval
feel free to pause the video here and
take a quick moment to calculate the
rates
in this RR interval there are six large
squares which gives us a heart rate of
50 beats per minute
this is bradycardic
this method only works if there's a
regular rhythm otherwise the RR interval
will be changing throughout the ECG
in those cases where the rhythm is
irregular we need to use the second
method
for this we count the number of QRS
complexes along the Rhythm strip and
multiply it by six
this works because the total length of
the Rhythm strip is 10 seconds so
multiplying it by 6 gives us one minute
again feel free to pause the video if
you'd like and take a moment to
calculate the heart rate
14 QRS complexes multiplied by 6 gives
us 84 beats per minute
this particular ECG has a regular rhythm
so you could use either method here
the next step in our interpretation is
the Rhythm which we use the Rhythm strip
to assess
broadly speaking we can classify rhythms
as regular or irregular
the safest method for assessing rhythm
is placing a piece of paper above the
start of the Rhythm strip and marking
three or four R waves
you can then move the paper along the
strip
if the lines match up with the
subsequent R waves then the rhythm is
regular
an irregular Rhythm could be described
as regularly irregular which means it's
irregular but it's quite a predictable
pattern
using the paper method we can see that
this ECG rhythm is irregular since
subsequent R waves do not line up
however there is a predictable pattern
to this ECG with there being two QRS
complexes followed by a pause then the
same again repeated
this particular ECG shows second-degree
AV block type 1. also known as
wankerback phenomenon
I'll cover AV heart block ECGs in more
detail in the next video titled ECG
abnormalities
irregular rhythms can also be
irregularly irregular where there's no
predictable pattern to the QRS complexes
here's an example
this particular ECG shows atrial
fibrillation which is the commonest
irregular irregular rhythm you're likely
to come across
again atrial fibrillation is covered in
more detail in the next video
our next step is assessing the cardiac
axis
at first glance this can be tricky to
get your head around but don't worry it
will eventually make sense
the cardiac axis refers to the average
direction of electrical depolarization
through the ventricles
in healthy individuals this average
direction is somewhere between -30 and
positive 90 degrees in the coronal plane
if the cardiac axis is pointing left of
-30 degrees there is left axis deviation
or if more than positive 90 there's
right Axis deviation
common causes of left axis deviation
include an inferior myocardial
infarction or wolf Parkinson White
syndrome
and right Axis deviation causes include
an anterior lateral myocardial
infarction right ventricular hypertrophy
or PE
now you will not be expected to
calculate the cardiac axis for medical
school exams however you should be able
to identify if there's left access
deviation or right Axis deviation
to do this we're going to use the QRS
complexes in three different leads
the more positive a QRS complex is in a
particular lead I.E the larger the
amplitude of the r wave the more in line
with this lead Direction the cardiac
axis is likely to lie
if a QRS complex is more negative it's
because the cardiac axis is not lined up
with this particular lead
it's these differences that can allow us
to work out the general direction of the
cardiac axis
I'll further illustrate this point by
comparing leads 2 and AVR
which you can see from the diagram on
the right are measuring depolarization
of the heart in complete opposite
directions
the resulting QRS complexes are
therefore inverted with lead 2 being
positive and AVR being negative
now in practice we commonly use leads
one two and three to ascertain if we
have a normal cardiac Axis or a deviated
one
this is because they almost replicate
the normal cardiac axis values between
-30 and positive 90 and they also lie
next to each other on ECG which makes
for easy comparison
so for a normal cardiac axis lead 2
should be more positive than least one
or three
in right Axis deviation
lead 3 will be more positive than lead 2
and 1. since the overall direction of
the polarization has moved clockwise to
the right
conversely in left axis deviation Lead 1
will be more positive than lead three
and two because the overall direction of
depolarization has moved to the left
so to quickly summarize the assessments
of the cardiac axis We compare leads 1 2
and 3 to decide whether there's left
axis deviation a normal Axis or right
Axis deviation
from now on in the interpretation we're
assetting individual components of the
ECG complex and it's therefore important
to assess these components in all 12
leads of the ECG to avoid missing any
abnormalities
first off is the P wave which represents
atrial depolarization
the questions we need to ask ourselves
here are are p waves present
and do they look normal
remember we need to be checking this in
all 12 leads
regarding the first question p waves
should precede every QRS complex
the complete absence of p waves with an
irregularly irregular Rhythm leads us to
the diagnosis of atrial fibrillation
this is a very common ECG in medical
school exams and also in clinical
practice so it's good to get familiar
with what this looks like
the second question that a p waste look
normal can lead us to two different
pathologies
peaked p waves also known as P pulmonale
represent right atrial enlargement
this is often seen in pulmonary
hypertension where the right atrium is
having to work hard to overcome the high
pressures in the pulmonary arteries
pulmonary hypertension is usually caused
by COPD which is a lung disease
predominantly though not exclusively
seen in smokers
the other cause of p waves not looking
normal is left atrial enlargements also
known as p mitrali
this is commonly associated with mitral
stenosis since the narrowing of the
mitral valve results in increased
pressure in the left atrium
P mitrali gives broad notched p waves
which look like the letter m
next we need to check the PR interval
this is the time from atrial
depolarization to ventricular
depolarization which essentially
represents atrial ventricular node
conduction
a normal PR interval is 0.12 to 0.2
seconds or 3 to 5 small squares
a prolonged PR interval is anything over
this
ECG shows a prolonged PR interval since
it's over 0.2 seconds or 5 small squares
having a constantly prolonged PR
interval is called first degree heart
block which is caused by the AV node
conducting electricity slower than
normal
this next ECG also has a prolonged Pi
interval but this time each successive
PR interval gets longer until eventually
a QRS complex is dropped
in this case every third QRS is missed
this is known as second-degree heart
block mobitz type 1. sometimes referred
to as wankerback phenomena
there is also second degree heart block
type 2 and 3rd degree heart block
I'll cover these in more detail in the
next video also just be aware the term
heart block is used synonymously with AV
block
after the PR interval we need to assess
the QRS complex
similar to assessing p waves there are
multiple questions we need to ask
firstly is width
is the QRS complex narrow
I.E is at less than 0.12 seconds or
three small squares
or is it broad I.E more than 0.12
seconds
narrow complexes are seen in any rhythm
where the wave of depolarization
originates from above the ventricles for
example normal sinus River
or atrio arrhythmias like atrial flutter
broad complexes originate from the
ventricles which is always abnormal
broad complexes may happen when there's
a bundle branch block
in other words one of the branches that
conducts electricity from the bundle of
hiss is not conducting as it should
a right bundle branch block gives us an
m shape in the V1 QRS complex and W in
V6
this can be remembered using the word
marrow
a left bundle branch block is the
opposite where there's a w in V1 and an
m in V6 this can be remembered using the
word William
next we need to assess height
small complexes are anything less than
five millimeters height in limb leads or
less than 10 millimeters in chest leads
small complexes are normal
large complexes therefore or anything
above this and can be abnormal
often representing left ventricular
hypertrophy
finally morphology I.E does it have a
normal shape
we can see in this ECG there's a slurred
upstroke at the start of the QRS complex
this is called a Delta wave and it's
abnormal
you can see this in Wolf Parkinson White
syndrome
the next ECG shows a pathological Q wave
which is longer and taller than normal
pathological Q waves often represents an
old myocardial infarction
the ST segment comes next
in healthy individuals the St segments
should rest on the isoelectric line
if elevated or depressed it can be a
sign of myocardial infarction
elevation is defined as over one
millimeters in limb leads or two
millimeters in chest leads
and depression is anything over 0.5
millimeters below the isoelectric line
if this is present in two or more
contiguous leads then ischemia is likely
present
for St elevation we refer to this as a
stemi
or St elevation myocardial infarction
this is usually due to ischemia that
affects the full thickness of The
myocardium
an MI without SD elevation is referred
to as an nstemi or non-st elevation
myocardial infarction
an nstemi doesn't necessarily have ST
depression it can also have an ST
segment on the isoelectric line
but with a raised troponin and presence
of chest pain this would lead us to the
diagnosis
an nstemi is usually due to partial
thickness ischemia
another differential to be aware of with
SD elevation is pericarditis which is
inflammation of the pericardium
surrounding the heart often thought to
be associated with viral infections
pericarditis gives saddle-shaped St
elevation which is widespread across
most leads
whereas astemi is often located in one
region
distinguishing between the two is
difficult with an ECG alone and is
slightly above the scope of medical
school exams so don't worry
however just be aware that this could be
a differential diagnosis where there's
St elevation seen on an ECG especially
if it's across many leads
the next step is assessment of T waves
which represents ventricular
repolarization
T waves can be described as tall
normal or inverted
tall T waves are associated with
hyperkalemia or with a stemi
normal T waves are less than five
millimeters in limb leads or 10
millimeters in chest leads
inverted T waves are a normal finding in
leaves 3 AVR and V1
but in other leads they may represent an
old myocardial infarction or a pulmonary
embolus
the final component to assess is the QT
interval which represents ventricular
depolarization and repolarization
together
a normal QT interval is less than 440
milliseconds in men or less than 460
milliseconds in women
it is commonly prolonged due to
medications
for example selective serotonin reuptake
Inhibitors or tricyclic antidepressants
and also antipsychotics but there are
other causes such as hypocalcemia
hypokalemia or incongenital longqt
syndrome
a significantly prolonged QT interval
can increase the risk of a patient
developing torsar's Deport which is a
ventricular arrhythmia that can cause
hemodynamic instability and can lead to
ventricular fibrillation and asystole
QT intervals can appear longer in
bradycardias and shorter and
tachycardias so it's common practice to
calculate the corrected QT interval
which standardizes the QT interval to 60
beats per minute
you don't need to remember any formulas
for doing this just be aware that this
is sometimes done for example using
bezet's formula
so to recap our ECG interpretation we
start by checking patient details and
the calibration of the ECG
we then move on to rate Rhythm and axis
followed by each ECG component in order
thanks for watching and feel free to
watch the third and final video in this
ECG series to learn more about the
common conditions you're going to come
across on ECGs in medical school exams
Browse More Related Video
ECG Interpretation Made Easy (Learn How to Interpret an ECG in 13 Minutes)
HOW TO READ AN ECG!! WITH ANIMATIONS(in 10 mins)!!
Introduction to ECG | The Basics | ECG Paper, PQRST wave, Rate, Rhythm, Axis and Interval
Myocardial Infarction[Heart Attack]; Causes, Pathogenesis, Signs & Symptoms, Diagnosis & Treatment
ECG Interpretation For Beginners. Different Leads and Axis Deviation
Cardiac Arrhythmias, Animation
5.0 / 5 (0 votes)