Finding The Correct Draw On Liquidity With 96% Accuracy..
Summary
TLDRThis video reveals a highly effective trading strategy focused on 'drawn liquidity,' targeting session highs and lows across Asia, London, and New York. Using the 15-minute chart to mark key levels and the 1-minute chart for precise entries, the method employs the 0.79 Fibonacci level and fair value gaps to predict price direction. By waiting for liquidity sweeps and trading with momentum, traders can consistently capture high-probability moves with minimal guesswork. The strategy is mechanical, applicable across markets like forex, crypto, and futures, and claims a 96% success rate for hitting drawn liquidity points, offering a disciplined, repeatable approach for traders.
Takeaways
- 😀 Identifying liquidity is crucial in trading; without the correct liquidity, models and strategies won’t work.
- 😀 The strategy involves focusing on session highs and lows (e.g., London high/low) as key liquidity levels.
- 😀 The 0.79 Fibonacci retracement level on the 1-minute timeframe is the critical point for determining trade direction.
- 😀 When price closes above or below the 0.79 level, it signals a strong potential move towards the opposite liquidity level.
- 😀 The strategy works with the London and New York trading sessions, but not the Asia session.
- 😀 A **96% success rate** is claimed when following this strategy, based on the Fibonacci retracement and liquidity sweeps.
- 😀 Traders should wait for market structure shifts after liquidity sweeps to confirm the direction and entry point.
- 😀 The use of fair value gaps within the dealing range helps pinpoint entry zones after closing above or below the 0.79 level.
- 😀 A clear, mechanical process is emphasized: identify liquidity levels, use Fibonacci, and enter after a 1-minute close above/below 0.79.
- 😀 The strategy works across various markets, including crypto, forex, gold, and futures, but it’s most effective with futures due to cleaner price action.
Q & A
What is the significance of liquidity in trading, according to the video?
-Liquidity is crucial in trading because it determines how easily assets can be bought or sold without affecting the market price. The video emphasizes that without understanding liquidity, trading models and strategies won't work effectively.
How can traders identify where the price is going in terms of liquidity?
-Traders can identify liquidity by marking session highs and lows on their charts (e.g., London high and London low). Price typically moves towards the opposite session's liquidity after a sweep occurs, making these points crucial for predicting price direction.
What is the secret technique mentioned in the video for determining liquidity draw?
-The secret technique involves using the Fibonacci retracement tool with a specific focus on the 0.79 level. When price closes above or below this level on the 1-minute chart, it indicates a high probability (96%) that the price will move towards the next liquidity point (either London high or low).
How does the Fibonacci retracement tool help in identifying liquidity?
-The Fibonacci retracement tool is used to measure the distance between session highs and lows. By adding the 0.79 level to the tool, traders can identify when price is likely to move towards liquidity. A close above or below this level signals the direction of the next price movement.
What timeframes are recommended for this strategy, and why?
-The strategy relies on using the 15-minute timeframe to identify session highs and lows, and the 1-minute timeframe to pinpoint precise entry points after the price closes above or below the 0.79 level. This combination helps in capturing precise moves towards liquidity.
What is the significance of the 0.79 Fibonacci level in the strategy?
-The 0.79 Fibonacci level acts as a 'switch' for traders. When price closes above or below this level on the 1-minute chart, it indicates a strong likelihood (96%) that the price will move towards the next liquidity point, such as the London high or low.
How does the entry model work in this strategy?
-The entry model involves waiting for price to close above or below the 0.79 level on the 1-minute timeframe. After that, traders look for fair value gaps within the price range. If a gap is present, the entry is made at the extreme of the gap, with a stop placed below the low of the price action.
What is a fair value gap, and how is it used in the entry strategy?
-A fair value gap is a space between price action where no trades have occurred. It often represents an area where price is expected to retrace or fill. In this strategy, fair value gaps are used as entry points once the price closes above or below the 0.79 level and shows a clear shift in market structure.
Why is the Asia session range important in this strategy?
-The Asia session range provides a reference for liquidity levels that may be swept before the New York session. If the Asia high or low is not taken out before New York opens, the strategy shifts focus to the London session highs and lows, which are considered more important in that case.
What should a trader do if there are no fair value gaps during the entry setup?
-If no fair value gaps are present, the trader should look for a break of market structure on the 1-minute chart. The trader will then apply the Fibonacci tool from the new high to the low and wait for a market structure shift, signaling an opportunity for entry.
Outlines

Этот раздел доступен только подписчикам платных тарифов. Пожалуйста, перейдите на платный тариф для доступа.
Перейти на платный тарифMindmap

Этот раздел доступен только подписчикам платных тарифов. Пожалуйста, перейдите на платный тариф для доступа.
Перейти на платный тарифKeywords

Этот раздел доступен только подписчикам платных тарифов. Пожалуйста, перейдите на платный тариф для доступа.
Перейти на платный тарифHighlights

Этот раздел доступен только подписчикам платных тарифов. Пожалуйста, перейдите на платный тариф для доступа.
Перейти на платный тарифTranscripts

Этот раздел доступен только подписчикам платных тарифов. Пожалуйста, перейдите на платный тариф для доступа.
Перейти на платный тарифПосмотреть больше похожих видео
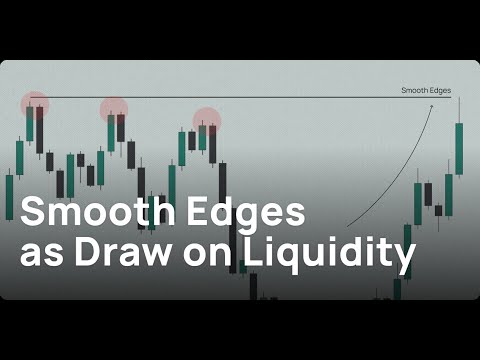
Smooth Edges as my +A Draw on Liquidity

This ICT Strategy NO DAILY BIAS but makes me $16,000/Week

Learn My Best Gold Trading Strategy in 8 Minutes (Perfect for Beginners)

Liquidity Pairing Session W / Bray (08/31/25)
20 Pips A Day Using ICT Asian Killzone Strategy (BETTER THAN SILVER BULLET)
Supercharge Your Trading with ICT's Daily/Weekly Range Secrets
5.0 / 5 (0 votes)
