Tableau Data Blending: Combining Multiple Data Sources | #Tableau Course #37
Summary
TLDRIn this video, the concept of data blending in Tableau is explored. The process involves combining data from two separate sources at the visualization level, using a left join method. The primary data source is marked with a blue icon, while the secondary data source is indicated by an orange one. Tableau's flexibility allows users to switch between primary and secondary data sources in different worksheets, offering customization for each visualization. The video also covers how to adjust blending relationships and join keys, highlighting the unique capability of data blending in Tableau compared to other BI tools like Power BI.
Takeaways
- 📊 Tableau uses data blending to combine data from multiple data sources at the visualization level, not in the data source itself.
- 🔵 The first data source queried by Tableau becomes the primary data source and is marked with a blue icon.
- 🟠 Any additional data source used in the same visualization is considered a secondary data source and is marked with an orange icon.
- 🔗 Tableau connects primary and secondary data sources using data blending, which relies on a left join that cannot be changed.
- 🧩 Data blending retrieves all data from the primary data source and only the matching records from the secondary one.
- 🧮 The blending relationship between data sources can be managed through 'Edit Blend Relationships,' where users can define or customize the join keys.
- 🧰 Keys used for blending can be activated or deactivated directly in the worksheet by clicking on the link icons beside fields.
- 🧾 Data blending settings apply only to the specific worksheet they are created in, allowing different blending configurations across worksheets.
- 🔁 The primary and secondary data sources can change depending on which data source’s field is used first in a given worksheet.
- 💡 Tableau’s data blending is a unique feature not found in many other BI tools, such as Microsoft Power BI.
- 🎥 The tutorial demonstrates how to create two data sources (CSV and JSON) and blend them using shared keys like Product ID.
- 👍 The instructor encourages supporting the content through likes and comments to help with YouTube’s algorithm.
Q & A
What is the primary difference between a primary and secondary data source in Tableau?
-In Tableau, the primary data source is the first data source used in the visualization and is marked with a blue icon. The secondary data source is used when additional data is needed from another source, and it is marked with an orange icon.
How does Tableau handle data blending between multiple data sources?
-Tableau uses data blending to combine data from multiple sources at the worksheet level. It performs a left join, where all data from the primary source is retrieved, and only the matching data from the secondary source is pulled into the visualization.
Can data blending in Tableau be performed at the data source level?
-No, data blending can only be performed at the visualization level (worksheet page) in Tableau, not at the data source level.
What join type does Tableau use when blending data, and can it be changed?
-Tableau uses a left join when blending data, and this join type cannot be changed. This means all records from the primary data source are retrieved, along with only the matching records from the secondary source.
How can you switch between multiple data sources in Tableau?
-You can switch between multiple data sources in Tableau by clicking the data source icon in the left pane, which allows you to choose between different data sources and view their tables.
What is the purpose of the blue and orange icons in Tableau data blending?
-The blue icon indicates the primary data source, while the orange icon indicates the secondary data source. These colors help distinguish between the two data sources in the blending process.
How can you define custom join keys in Tableau data blending?
-To define custom join keys in Tableau, you go to the 'Edit Blend Relationships' menu. From there, you can specify the fields from both the primary and secondary data sources that should be used to join the data.
Is data blending in Tableau applicable to all worksheets, or is it specific to one worksheet?
-Data blending in Tableau is specific to each worksheet. If you switch to a new worksheet, the primary and secondary data source setup will reset, allowing you to configure the blending independently for each worksheet.
How do you change the primary and secondary data sources in a worksheet?
-To change the primary and secondary data sources in Tableau, you simply drag and drop the relevant fields into the visualization. The first data source used becomes the primary, while the second data source becomes the secondary. You can also manually switch the primary and secondary sources by selecting the appropriate data source in the left pane.
What happens if you try to join two data sources using incorrect keys in Tableau?
-If you use incorrect join keys in Tableau, the resulting data will be incorrect, and Tableau will indicate the broken link (e.g., a broken chain icon) between the fields. You can deactivate or activate the join keys as needed to correct the issue.
Outlines

Этот раздел доступен только подписчикам платных тарифов. Пожалуйста, перейдите на платный тариф для доступа.
Перейти на платный тарифMindmap

Этот раздел доступен только подписчикам платных тарифов. Пожалуйста, перейдите на платный тариф для доступа.
Перейти на платный тарифKeywords

Этот раздел доступен только подписчикам платных тарифов. Пожалуйста, перейдите на платный тариф для доступа.
Перейти на платный тарифHighlights

Этот раздел доступен только подписчикам платных тарифов. Пожалуйста, перейдите на платный тариф для доступа.
Перейти на платный тарифTranscripts

Этот раздел доступен только подписчикам платных тарифов. Пожалуйста, перейдите на платный тариф для доступа.
Перейти на платный тарифПосмотреть больше похожих видео

How Much SQL, Python, Excel & Tableau Is Enough? | Realistic Expectations

Belajar Tableau : Apa itu Tableau?

Tableau Data Modeling and Layers (Physical & Logical) | #Tableau Course #33
What is Tableau ? Explained in under 10 mins!

Word Formation: Blending
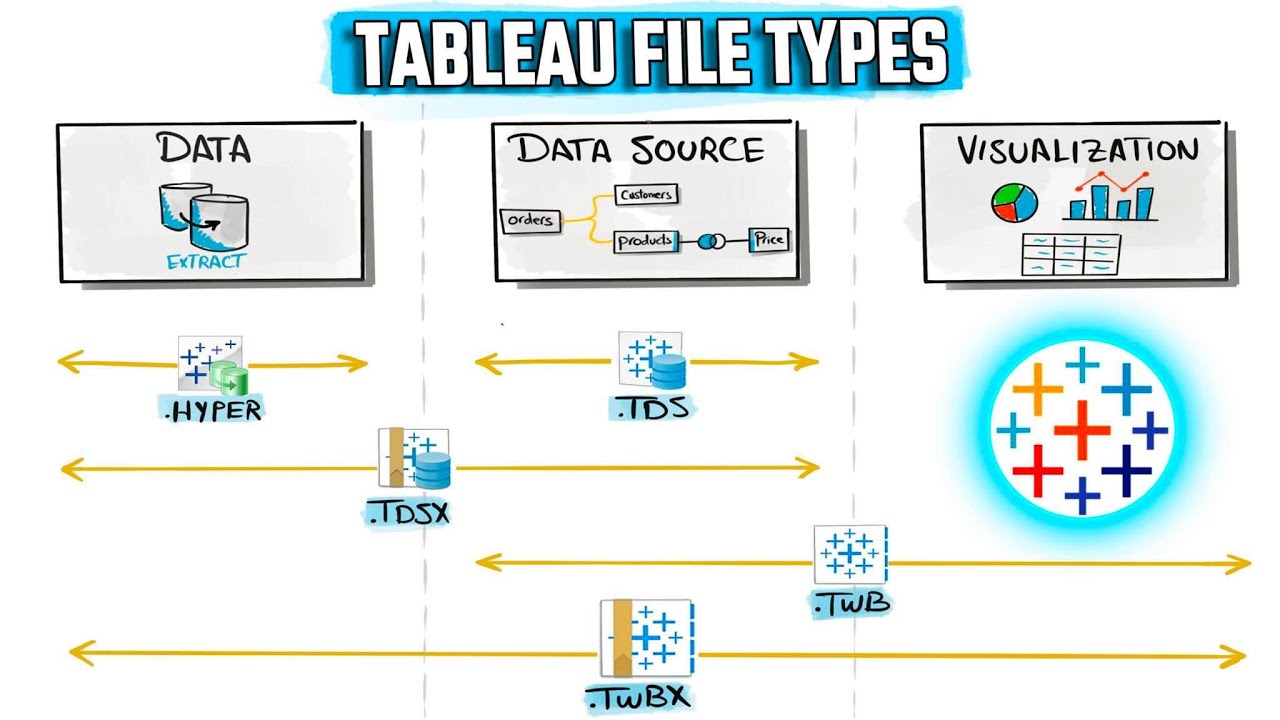
Tableau File Types: TWB, TWBX, TDS, TDSX, HYPER | #Tableau Course #20
5.0 / 5 (0 votes)
