IR Infrared Spectroscopy Practice Problems - Real Spectra
Summary
TLDRThis video guides viewers through solving IR spectroscopy problems by focusing on key functional group identification rather than the entire spectrum. It explains how to analyze diagnostic regions above 1500 cm⁻¹, classify C–H bonds by hybridization (sp³, sp², sp), identify broad O–H or N–H peaks, and recognize carbonyl C=O peaks around 1700 cm⁻¹. The tutorial emphasizes systematic elimination of candidate molecules based on observed peaks, including triple bonds and aromatic signals. Through clear examples, it demonstrates how to match IR spectra to molecular structures, making IR analysis approachable, logical, and efficient even for complex compounds.
Takeaways
- 😀 IR spectroscopy is primarily used to identify functional groups in a molecule, not to determine the full structure.
- 😀 Focus on the diagnostic region (>1500 cm⁻¹) for functional group analysis; the fingerprint region (<1500 cm⁻¹) is used mainly for distinguishing very similar compounds.
- 😀 Draw a line at 3000 cm⁻¹ to differentiate C–H bonds: below 3000 = sp³, above 3000 = sp², around 3300 = sp (triple bond).
- 😀 Broad peaks between 3200–3600 cm⁻¹ indicate hydrogen bonded to heteroatoms, such as O–H or N–H.
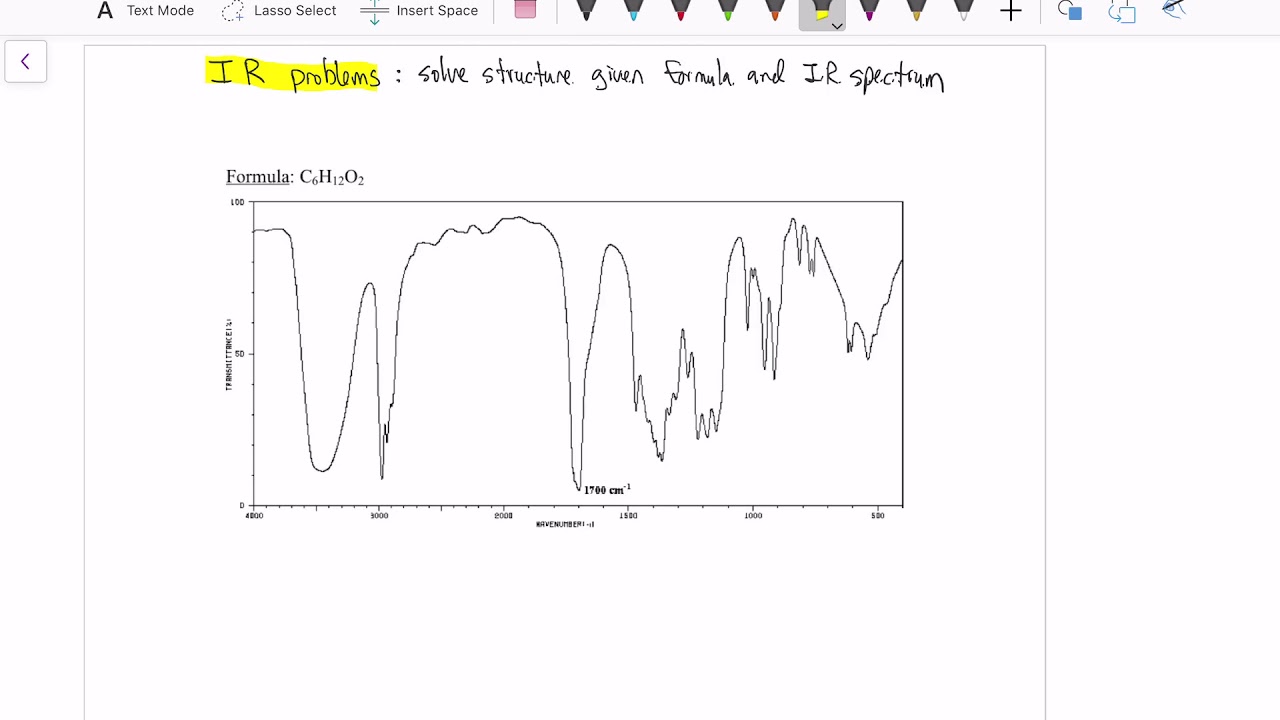
- 😀 Strong peaks around 1700 cm⁻¹ indicate a carbonyl group (C=O), which could be a ketone, aldehyde, carboxylic acid, ester, or acid chloride.
- 😀 Peak intensity can be classified as weak (top 1/3), medium (middle 1/3), or strong (bottom) based on absorption amplitude.
- 😀 Aromatic compounds can be identified by weak overtones (1700–2000 cm⁻¹) and characteristic peaks around 1600–1650 cm⁻¹.
- 😀 Stepwise analysis: first identify C–H types, then check for O–H/N–H, look for C=O, and finally compare with candidate molecules.
- 😀 Overlapping peaks can occur, e.g., O–H overlapping with sp² C–H, which may make interpretation appear complex but can be resolved with careful analysis.
- 😀 Elimination of candidate compounds is based on the absence or presence of specific peaks corresponding to functional groups, triple bonds, or aromatic features.
- 😀 Identifying sp, sp², and sp³ hybridized carbons in combination with other functional group information often allows correct identification of the molecule in multiple-choice problems.
- 😀 IR spectra interpretation relies on patterns and correlations, not memorization of every peak; focusing on key regions simplifies analysis.
Q & A
What is the primary purpose of IR spectroscopy?
-IR spectroscopy is primarily used to identify the functional groups present in a molecule rather than determining the complete structure.
Which region of an IR spectrum is referred to as the fingerprint region?
-The fingerprint region is the portion of the IR spectrum below 1500 cm⁻¹, which is typically used for detailed analysis to distinguish between very similar compounds.
How can you differentiate sp³, sp², and sp C–H bonds in an IR spectrum?
-Draw a line at 3000 cm⁻¹: peaks below 3000 indicate sp³ C–H bonds, peaks slightly above 3000 indicate sp² C–H bonds, and a sharp peak around 3300 cm⁻¹ corresponds to sp (alkyne) C–H bonds.
What does a broad peak between 3200–3600 cm⁻¹ indicate?
-A broad peak in this region typically corresponds to hydrogen atoms bonded to heteroatoms, such as O–H or N–H groups, indicating hydroxyl or amine functionalities.
Where does a carbonyl group typically appear in an IR spectrum?
-A carbonyl group (C=O) usually shows a strong absorption peak around 1700 cm⁻¹, which may vary slightly depending on the type of carbonyl compound.
Why is the fingerprint region often ignored in initial IR analysis?
-Because it contains complex and numerous peaks, it is usually only necessary when distinguishing very similar compounds; initial analysis focuses on the more diagnostic region above 1500 cm⁻¹.
How can IR spectroscopy help eliminate incorrect candidate molecules?
-By comparing observed peaks for functional groups (C–H types, OH/NH, C=O) with the expected peaks of candidate molecules, those that lack key peaks can be excluded.
What is the significance of overlapping peaks in an IR spectrum?
-Overlapping peaks, such as an O–H peak overlapping with sp² C–H peaks, can complicate analysis, but careful comparison with expected functional groups allows correct identification.
How can aromatic compounds be identified using IR spectroscopy?
-Aromatic compounds may show peaks between 1600–1650 cm⁻¹ for C=C stretching and weak aromatic overtones between 1700–2000 cm⁻¹.
Why is the intensity of IR peaks (weak, medium, strong) important?
-Peak intensity helps assess the strength of absorption and can confirm the presence of specific functional groups, aiding in accurate identification.
What steps should be taken to systematically identify a compound using IR spectroscopy?
-Step 1: Identify C–H bond types using the 3000 cm⁻¹ line. Step 2: Check for broad O–H/N–H peaks. Step 3: Identify strong carbonyl peaks around 1700 cm⁻¹. Step 4: Consider additional peaks such as aromatic overtones. Step 5: Compare all observed peaks with candidate molecules and eliminate those that do not match.
Can IR spectroscopy alone always determine the full structure of a molecule?
-No, IR spectroscopy is not comprehensive; it is mainly used to identify functional groups and can give a strong indication of the structure, but complete structural determination usually requires additional spectroscopic methods.
Outlines

Этот раздел доступен только подписчикам платных тарифов. Пожалуйста, перейдите на платный тариф для доступа.
Перейти на платный тарифMindmap

Этот раздел доступен только подписчикам платных тарифов. Пожалуйста, перейдите на платный тариф для доступа.
Перейти на платный тарифKeywords

Этот раздел доступен только подписчикам платных тарифов. Пожалуйста, перейдите на платный тариф для доступа.
Перейти на платный тарифHighlights

Этот раздел доступен только подписчикам платных тарифов. Пожалуйста, перейдите на платный тариф для доступа.
Перейти на платный тарифTranscripts

Этот раздел доступен только подписчикам платных тарифов. Пожалуйста, перейдите на платный тариф для доступа.
Перейти на платный тарифПосмотреть больше похожих видео

(16) IR Spectroscopy | Introduction to Infrared (IR) Spectroscopy | Instrumental Method of Analysis

Introduction to Infrared Spectroscopy

Introduction to IR Spectroscopy: How to Read an Infrared Spectroscopy Graph

IR Spectroscopy
Determine structures from IR spectra

How to Read and Interpret the IR Spectra | Step-by-Step Guide to IR Spectroscopy
5.0 / 5 (0 votes)
