z - Score Word Problem Part 1
Summary
TLDRIn this lesson, the instructor explains the concept of z-scores through examples involving normal distributions. The z-score formula, which calculates how far a data point is from the mean in terms of standard deviations, is introduced and applied. The instructor provides detailed examples, such as determining the z-score for an observation of 12.5, scores 20 points above or below the mean, and scores of 60 and 80 with specific means. Emphasis is placed on interpreting key words like 'above' and 'below' the mean to determine whether the z-score should be positive or negative.
Takeaways
- 😀 The lesson focuses on solving word problems involving z-scores.
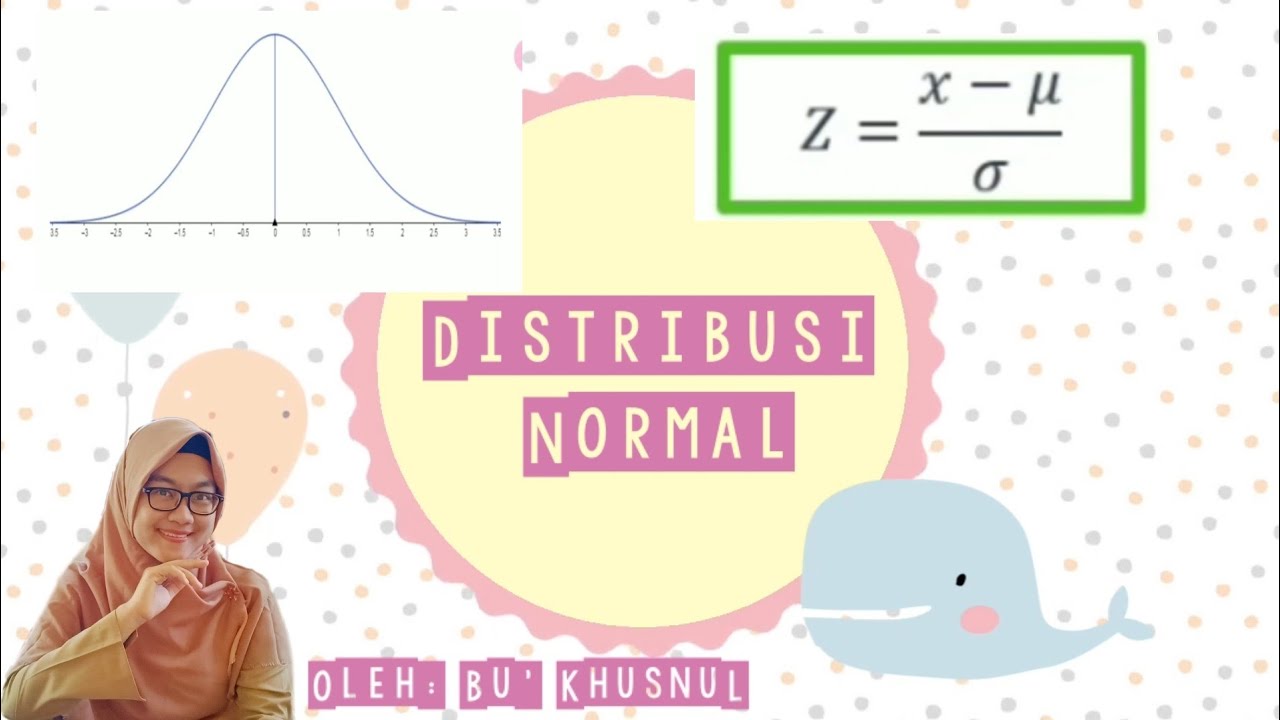
- 😀 To calculate a z-score, use the formula: z = (X - mean) / standard deviation.
- 😀 A z-score represents the number of standard deviations a value is away from the mean.
- 😀 In the first example, for a population with a mean of 10 and standard deviation of 2, a score of 12.5 results in a z-score of 1.25.
- 😀 Z-scores can be positive or negative based on whether the value is above or below the mean.
- 😀 In the second example, a score 20 points above the mean gives a z-score of +2 (since the numerator is 20).
- 😀 A score 10 points below the mean results in a z-score of -1, as the numerator is negative (since it's below the mean).
- 😀 The mean and standard deviation are crucial for calculating z-scores in word problems.
- 😀 For a score of 60 with a mean of 40 and a standard deviation of 10, the z-score is 2.
- 😀 When a score of 80 is given with a mean of 55 and standard deviation of 10, the z-score is 2.5.
- 😀 Pay attention to key terms like 'above the mean' and 'below the mean' to determine whether the z-score will be positive or negative.
Q & A
What is the formula for calculating a z-score?
-The formula for calculating a z-score is: Z = (X - μ) / σ, where X is the observation, μ is the mean, and σ is the standard deviation.
In Example 1, why is the z-score for 12.5 equal to 1.25?
-In Example 1, the z-score for 12.5 is calculated as: (12.5 - 10) / 2 = 2.5 / 2 = 1.25. This means the score 12.5 is 1.25 standard deviations above the mean.
How do we handle a situation where the observation is above the mean when calculating the z-score?
-If the observation is above the mean, the numerator in the z-score formula will be positive (X - μ), resulting in a positive z-score, indicating the score is above the mean.
In Example 2(a), why is the z-score for a score 20 points above the mean equal to 2?
-In Example 2(a), since the observation is 20 points above the mean, the z-score is calculated as 20 / 10 = 2, meaning the score is 2 standard deviations above the mean.
What does a negative z-score indicate?
-A negative z-score indicates that the observation is below the mean. For example, in Example 2(b), a score 10 points below the mean gives a z-score of -1.
What does a z-score of 0 mean?
-A z-score of 0 means that the observation is exactly equal to the mean.
Why is the standard deviation important in calculating a z-score?
-The standard deviation is important because it measures the spread of data points. It helps normalize the data, so the z-score shows how far the observation is from the mean in terms of standard deviations.
How is the z-score used to compare different observations within a normal distribution?
-The z-score allows you to compare how far different observations are from the mean in terms of standard deviations. A higher z-score indicates that the observation is further from the mean.
In Example 3(b), why is the z-score for a score of 80 with a mean of 55 equal to 2.5?
-In Example 3(b), the z-score is calculated as (80 - 55) / 10 = 25 / 10 = 2.5. This means the score of 80 is 2.5 standard deviations above the mean of 55.
How do you handle cases where the mean is not provided in a z-score problem?
-If the mean is not directly provided, you can often deduce it from the context. For example, if the problem states that a score is a certain number of points above or below the mean, you can use that information to calculate the z-score without explicitly knowing the mean.
Outlines

Этот раздел доступен только подписчикам платных тарифов. Пожалуйста, перейдите на платный тариф для доступа.
Перейти на платный тарифMindmap

Этот раздел доступен только подписчикам платных тарифов. Пожалуйста, перейдите на платный тариф для доступа.
Перейти на платный тарифKeywords

Этот раздел доступен только подписчикам платных тарифов. Пожалуйста, перейдите на платный тариф для доступа.
Перейти на платный тарифHighlights

Этот раздел доступен только подписчикам платных тарифов. Пожалуйста, перейдите на платный тариф для доступа.
Перейти на платный тарифTranscripts

Этот раздел доступен только подписчикам платных тарифов. Пожалуйста, перейдите на платный тариф для доступа.
Перейти на платный тарифПосмотреть больше похожих видео

Identifying Appropriate Rejection Region for a given Level of Significance
CONVERTING A NORMAL RANDOM VARIABLE TO A STANDARD NORMAL VARIABLE AND VICE VERSA
Z-Scores and Percentiles: Crash Course Statistics #18
Types Of Distribution In Statistics | Probability Distribution Explained | Statistics | Simplilearn
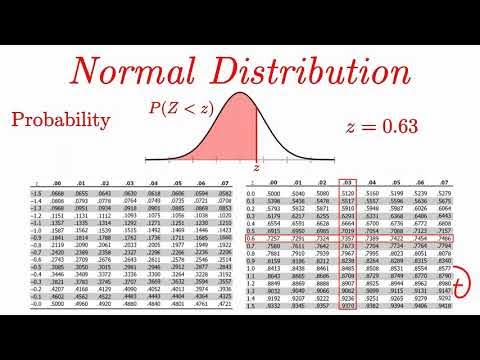
Normal Distribution EXPLAINED with Examples
Distribusi Normal | Konsep Dasar dan Sifat Kurva Normal | Matematika Peminatan Kelas 12
5.0 / 5 (0 votes)
