Aula 08 - Parte 1
Summary
TLDRThis video covers the concepts of random variables and probability distributions, focusing on examples like a dice game and colorblindness in a group. It introduces random experiments, where outcomes are probabilistic, such as the sum of two dice. The key concept explored is the random variable, which can take various values, each with an associated probability. The video explains how to calculate probabilities and construct probability distributions, highlighting how certain sums, like 7 in the dice game, are more likely than others. The lesson also touches on discrete and continuous random variables, emphasizing the importance of probability distributions.
Takeaways
- 😀 A random variable is a numerical function that assigns values to possible outcomes of a random experiment.
- 😀 A probability distribution shows the likelihood of each value a random variable can assume.
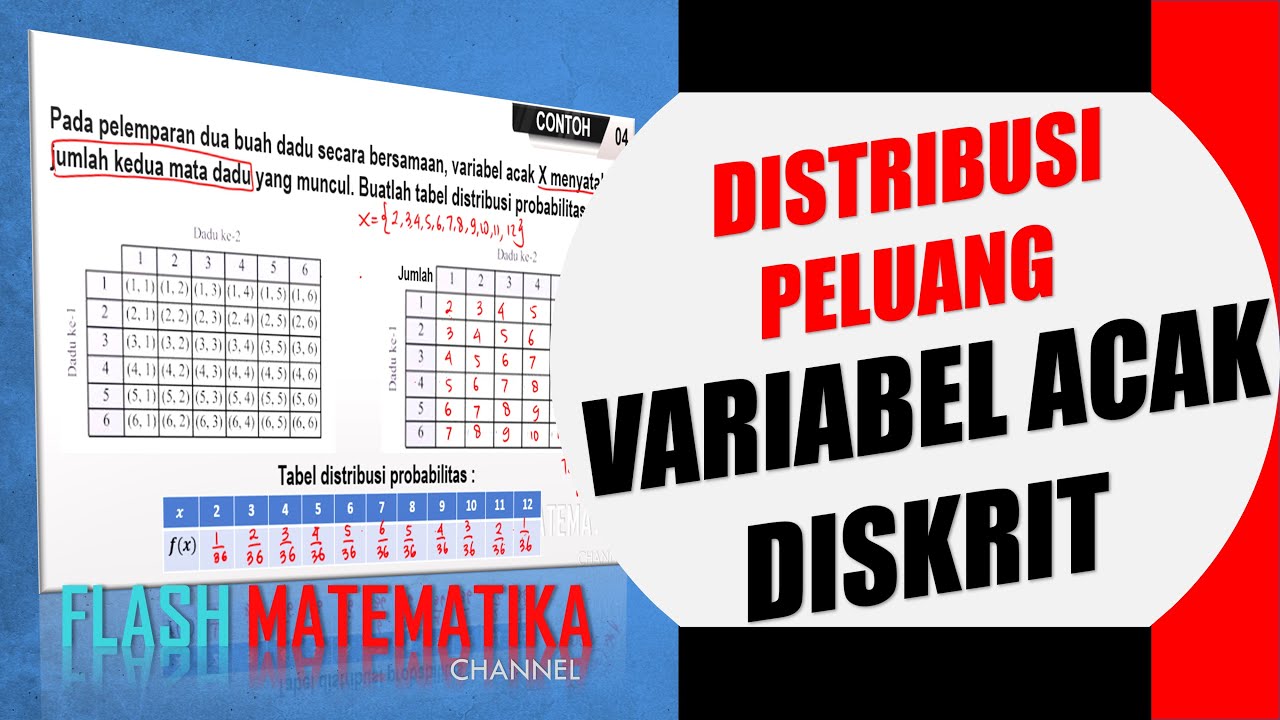
- 😀 In the dice example, the sum of the dice faces is a random variable, with values ranging from 2 to 12.
- 😀 The sample space of an experiment includes all possible outcomes, and for rolling two dice, this sample space consists of 36 combinations.
- 😀 The sum of 7 in a dice roll is the most probable outcome because there are six different combinations that result in a sum of 7.
- 😀 A probability distribution can be represented with a table or graph showing the probability of each outcome.
- 😀 The probability distribution for rolling two dice is not uniform; some sums are more likely than others, such as 7 being more probable than 2 or 12.
- 😀 Random variables can be discrete (like the number of colorblind people) or continuous (like someone's weight).
- 😀 The sum of the probabilities in a probability distribution must always equal 1.
- 😀 In the colorblindness example, the random variable represents the number of colorblind people among three selected individuals, with an equal probability for each person being colorblind or not.
Q & A
What is a random experiment, and can you give an example?
-A random experiment is an experiment where the outcome is uncertain. For example, rolling two dice and summing the results is a random experiment because the outcome cannot be predicted with certainty.
What is the sample space of a random experiment?
-The sample space refers to the set of all possible outcomes of a random experiment. In the case of rolling two dice, the sample space consists of all the possible sums of the dice, ranging from 2 to 12.
How do you define a random variable?
-A random variable is a numerical function that assigns a value to each outcome in the sample space of a random experiment. For example, the random variable in the dice game is the sum of the two dice.
What is the probability distribution of a random variable?
-A probability distribution shows the likelihood of each possible value a random variable can assume. It associates each possible outcome with a probability, with all probabilities summing up to 1.
Why is the sum of 7 the most likely outcome when rolling two dice?
-The sum of 7 is the most likely because it can occur in the greatest number of ways—six different combinations (e.g., 1+6, 2+5, 3+4, etc.). In contrast, other sums like 2 and 12 only have one possible combination.
What are the differences between a frequency distribution and a probability distribution?
-A frequency distribution is based on actual data and shows how often each outcome occurred. A probability distribution, on the other hand, is theoretical and shows the likelihood of each possible outcome before the experiment is conducted.
What is the significance of a probability distribution in understanding random variables?
-A probability distribution is significant because it helps us understand the likelihood of different values a random variable can assume. It also allows us to make predictions based on probabilities.
Can a random variable be both discrete and continuous? Provide examples.
-Yes, a random variable can be both discrete and continuous. A discrete random variable can only take specific values (e.g., the number of heads in coin flips), while a continuous random variable can take any value within a range (e.g., someone's height or weight).
In the colorblindness experiment, what is the random variable and what are its possible values?
-In the colorblindness experiment, the random variable is the number of colorblind people in a group of three. The possible values are 0, 1, 2, or 3 colorblind people.
How can we calculate the probability distribution for the colorblindness experiment?
-We can calculate the probability distribution by assuming each person has a 50% chance of being colorblind. Based on this assumption, we calculate the probabilities of having 0, 1, 2, or 3 colorblind people among the three randomly selected individuals.
Outlines

Этот раздел доступен только подписчикам платных тарифов. Пожалуйста, перейдите на платный тариф для доступа.
Перейти на платный тарифMindmap

Этот раздел доступен только подписчикам платных тарифов. Пожалуйста, перейдите на платный тариф для доступа.
Перейти на платный тарифKeywords

Этот раздел доступен только подписчикам платных тарифов. Пожалуйста, перейдите на платный тариф для доступа.
Перейти на платный тарифHighlights

Этот раздел доступен только подписчикам платных тарифов. Пожалуйста, перейдите на платный тариф для доступа.
Перейти на платный тарифTranscripts

Этот раздел доступен только подписчикам платных тарифов. Пожалуйста, перейдите на платный тариф для доступа.
Перейти на платный тарифПосмотреть больше похожих видео

Overview, Sample Space & Types of Events | Statistics and Probability | By GP Sir
Distribusi Peluang Variabel Acak Diskrit Part 1

[Statistika]: Macam-Macam Distribusi Probabilitas (Binomial, Poisson, Normal dan Student-T)

Probability Distribution Functions (PMF, PDF, CDF)
Pertemuan 1 - Distribusi Probabilitas (Part 2)

Random variables | Probability and Statistics | Khan Academy
5.0 / 5 (0 votes)
