Correlation Analysis
Summary
TLDRIn this video, the concept of correlation analysis is explored, specifically focusing on Pearson's product-moment correlation. The presenter explains the relationship between two variables, highlighting positive and negative linear correlations, as well as situations with no correlation. The video delves into the steps of analyzing data, such as checking for normality and linearity before testing hypotheses. The significance of correlation is evaluated, and an example of learning motivation and reading scores is used to demonstrate the process. The analysis concludes with the rejection of the null hypothesis, confirming a significant positive correlation between the two variables.
Takeaways
- 😀 The script explains the concept of correlation analysis between two variables, focusing on Pearson's Product Moment Correlation.
- 😀 It introduces three types of correlation: positive linear correlation, negative linear correlation, and no correlation (independent).
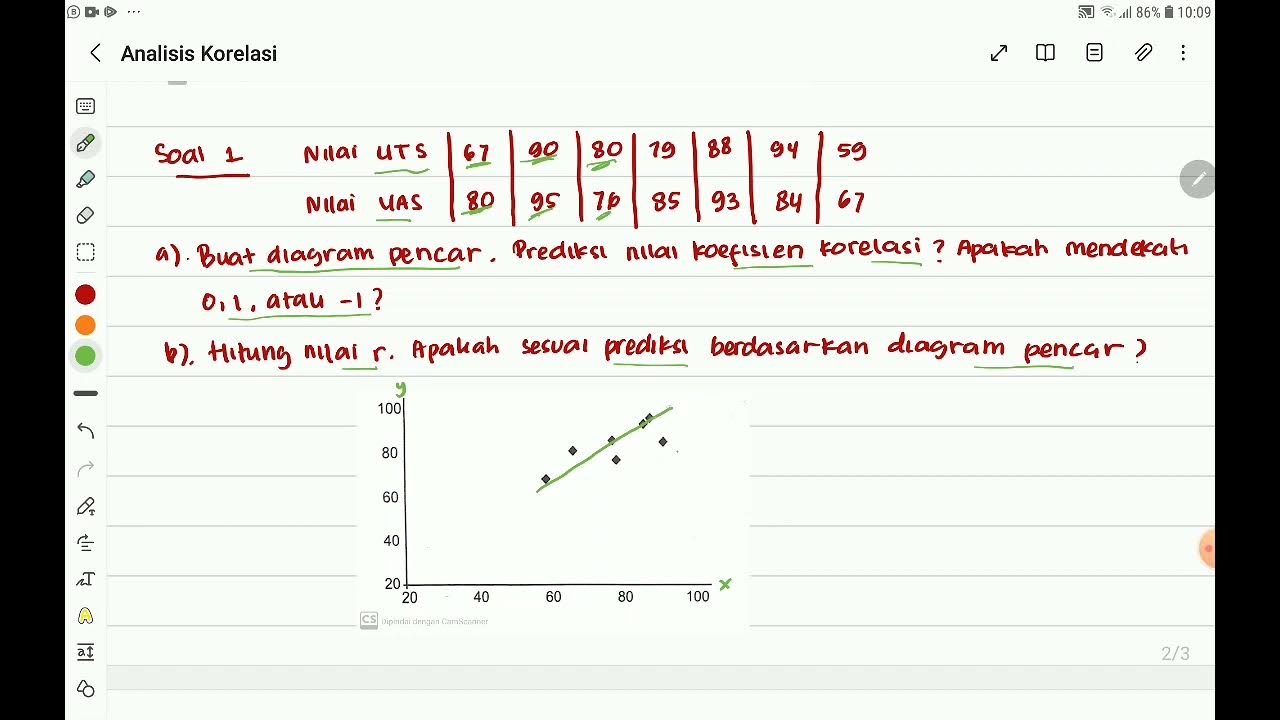
- 😀 A positive linear correlation means that as one variable increases, the other also increases (e.g., high learning motivation leads to a higher reading score).
- 😀 A negative linear correlation means that as one variable increases, the other decreases (e.g., higher anxiety leads to lower speaking scores).
- 😀 When no correlation exists, there is no predictable relationship between the two variables, and a straight line cannot be drawn between them.
- 😀 The strength of the correlation is denoted by the 'R' value, which ranges from -1 to +1, with higher values indicating a stronger correlation.
- 😀 An 'R' value of 0 means there is no association between the variables, while positive or negative values indicate the direction of the relationship.
- 😀 The significance of the correlation is determined by hypothesis testing, where a p-value below 0.05 indicates a significant correlation.
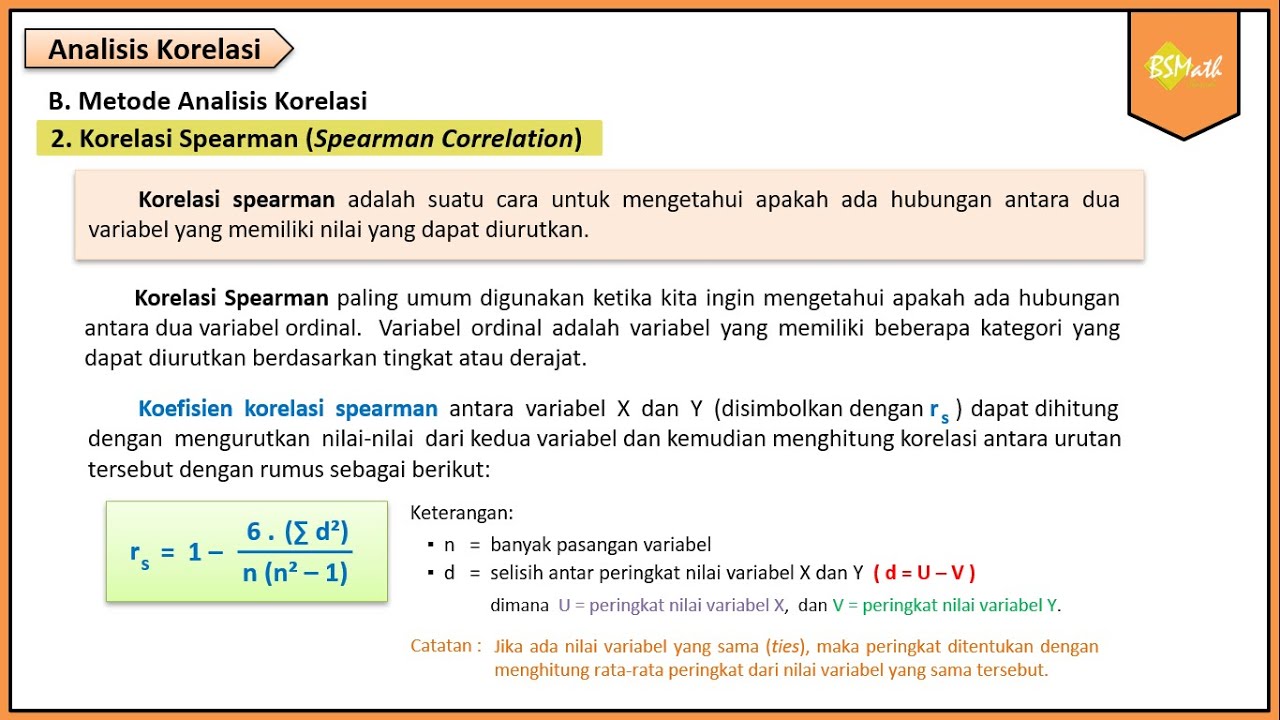
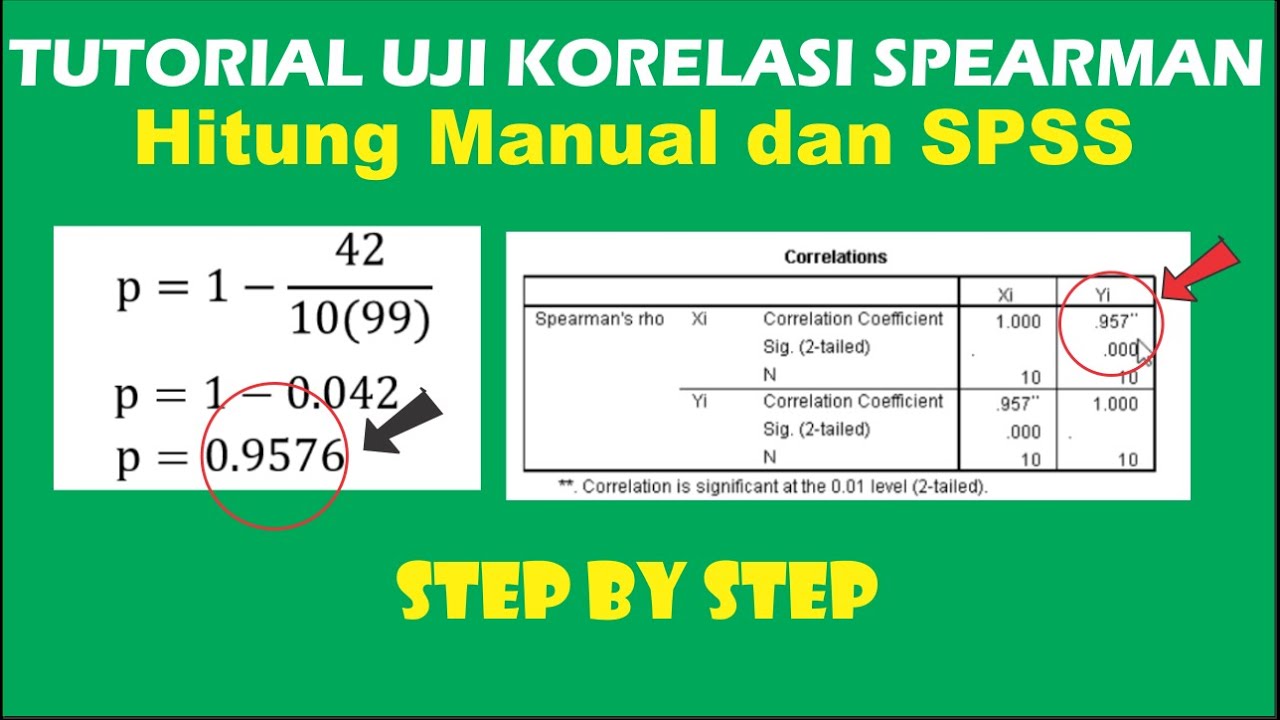
- 😀 The process of checking normality is important before conducting correlation analysis. If the data is not normal, Pearson’s correlation cannot be used and Spearman's correlation should be applied.
- 😀 To test linearity, a deviation from linearity test is conducted, and if the p-value is above 0.05, it means the data follows a linear relationship, making Pearson’s correlation valid.
- 😀 The hypothesis testing for correlation requires calculating the Pearson's correlation coefficient, and if the p-value is below 0.05, the null hypothesis (no correlation) is rejected, confirming a significant correlation.
Q & A
What is Pearson's Product Moment Correlation used for?
-Pearson's Product Moment Correlation is used to measure the strength and direction of the linear relationship between two variables. It helps determine whether and how strongly two variables are related.
What does the R value represent in correlation analysis?
-The R value represents the degree of association between two variables. It ranges from -1 to +1, with the sign indicating the direction of the relationship (positive or negative) and the magnitude indicating the strength of the association.
What does a positive linear correlation mean?
-A positive linear correlation means that as one variable increases, the other variable also increases. For example, if learning motivation increases, the reading score also increases.
What does a negative linear correlation indicate?
-A negative linear correlation indicates that as one variable increases, the other variable decreases. For instance, if learning motivation is high, the reading score might be low.
What is the significance of a correlation value of 0?
-A correlation value of 0 indicates no relationship or association between the two variables. The values do not show any predictable pattern or trend.
What test is used to determine if a correlation is significant?
-To determine if a correlation is significant, the Pearson correlation test is used. If the p-value is below 0.05, the correlation is considered statistically significant.
How is the hypothesis for a correlation analysis structured?
-The hypothesis for a correlation analysis typically includes a null hypothesis (H0), which suggests no significant correlation, and an alternative hypothesis (H1), which suggests that there is a significant correlation between the two variables being tested.
What should you do if the data is not normally distributed?
-If the data is not normally distributed, Pearson’s correlation should not be used. Instead, a non-parametric test such as Spearman’s rank correlation should be applied.
What is the importance of checking linearity in correlation analysis?
-Checking linearity is crucial because Pearson’s correlation assumes that the relationship between the variables is linear. If the relationship is not linear, Pearson’s correlation may not provide accurate results.
What do you do if the deviation from linearity test is significant?
-If the deviation from linearity test is significant (p-value below 0.05), it indicates that the data does not follow a linear relationship, and Pearson’s correlation cannot be used. In this case, Spearman’s correlation should be considered.
Outlines

Этот раздел доступен только подписчикам платных тарифов. Пожалуйста, перейдите на платный тариф для доступа.
Перейти на платный тарифMindmap

Этот раздел доступен только подписчикам платных тарифов. Пожалуйста, перейдите на платный тариф для доступа.
Перейти на платный тарифKeywords

Этот раздел доступен только подписчикам платных тарифов. Пожалуйста, перейдите на платный тариф для доступа.
Перейти на платный тарифHighlights

Этот раздел доступен только подписчикам платных тарифов. Пожалуйста, перейдите на платный тариф для доступа.
Перейти на платный тарифTranscripts

Этот раздел доступен только подписчикам платных тарифов. Пожалуйста, перейдите на платный тариф для доступа.
Перейти на платный тарифПосмотреть больше похожих видео
Analisis Korelasi "Nilai Koefisien Korelasi dan Tingkat Korelasi" Part 1 Mtk 11 SMA Kmerdeka
Korelasi Spearman - Matematika Wajib SMA Kelas XI Kurikulum Merdeka

KULIAH STATISTIK - ANALISIS KORELASI
Tutorial atau Cara Uji Korelasi Spearman Hitung Manual dan SPSS

Tutorial Uji Korelasi Pearson dengan SPSS - Cara Uji Korelasi Product Moment

Regresi dan Korelasi Sederhana
5.0 / 5 (0 votes)
